9840 trade ideas

OPENING: GLD SEPT 20TH 128/130 LONG PUT VERTICAL... for a .21/contract debit. (Late Post)
Metrics:
Max Profit: $179/contract
Max Loss: $21/contract
Break Even: 129.79
Delta/Theta: -6.26/-.43
Notes: Put this on in the closing minutes of Friday's session. Looking for a move back to the short-term range lows ... .

Gold Gold still has held the zone and is looking better and targets are up there in that box.. its about 1600 on the futures.

Short for GLD from a rising channel I identified two rising channels developing since August, along side with a smaller one. There was a breakout towards downtrend in the upper channel.
Entry: 142.34
I sold a call credit spread to short the position. Currently, it seems that it is about to break the lower rising channel.

GLD inside bar continuation Looking for a break below the candlestick that is before the inside bar.
There was a nice retrace to the 38.2 fib level and 20 MA. GLD bounced from those levels with 2 solid bear moves, and the volume was solid for both.
If GLD breaks below the low of the 1st candle, I will enter short and possibly take a 2 target trade.
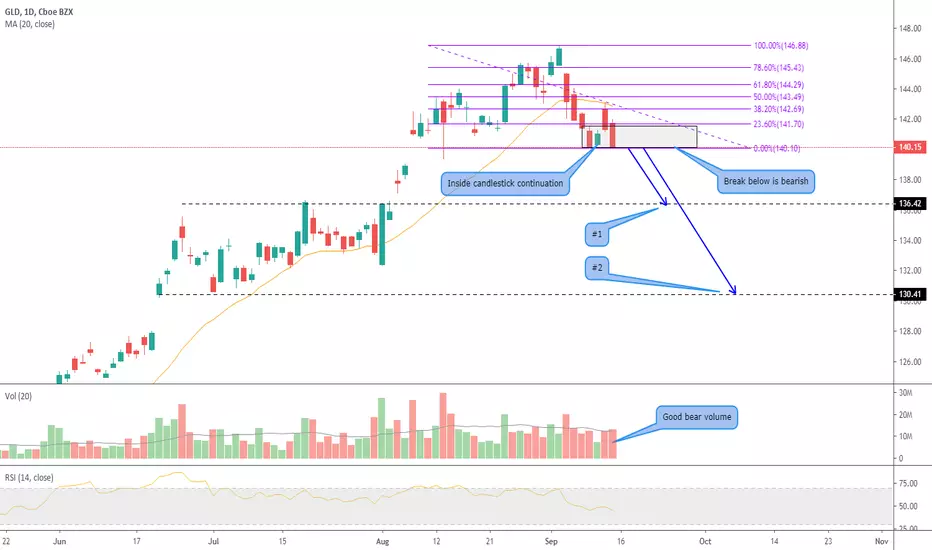

GLD - Daily - Inside bar setupBearish gold fits the narrative right now - the S&P wants to climb.
Technically, GLD made an inside candle bar today. Inside bars can be bearish continuation patterns if the low of the previous candle (the "mother" candle) can be broken. Or, they can be bullish continuation if the high of the previous candle (the "mother" candle) can be broken. In this situation, I'm looking for a bearish continuation. But, I will wait until the low of the mother candle is broken with a close below it.
Fundamentally, this bearish situation makes sense. SPY (S&P ETF) is doing all it can to break the all time high at roughly 302 ... whether SPY can break above and hold it, is yet to be determined. However, like I was saying, a bearish gold scenario fits this story line. When people are excited (risk on) they take their money out of safe haven equities such as gold (risk off), and put it in riskier investments. Traditionally, gold and bonds are the "safe space" for nervous investors. No nervousness = no "safe space" ... and the GLD sell off should continue. Not too mention, gold is up $200 per ounce YTD; it has room to pull back.

Watch the videoscreencast-o-matic.com ignore the chart.. this was the only way i could post the video..... This was for my trading room... basics of symmetry. Gold does have support here so watch for triggers but its not the point of this


Don't Short Gold Just YetInsiders think bonds and metals will sell-off as the Fed remains hawkish. I thought the same until I saw this chart. 6 year round bottom with backtest almost complete. This could rocket higher than anyone thought possible.

GLD Short SpreadPut Spread on GLD 143/138
Cost is $2.14
EXP is Oct 18
Max loss is $140 Max gain is $190
Gold is starting to go down as market is being sated by good trade news.

Gold Turning Down From Important ResistanceThis is a follow up to my 8/8/19 GLD post. There was expected resistance in the zone around 50% retrace of the last Gold bear market. Gold and the ETF - GLD marginally exceeded the target with significant bearish divergences. Since the peak, daily MACD and Stochastics have had line bear crosses. Daily RSI has a bearish divergence.
If the Elliott wave count illustrated in my 8/8/19 post is correct, GLD has potential to retrace at least the entire rally since the bear market bottom. Gold price could ultimately reach $900 to $1000 zone.
GLD first support zone is in the 130 to 134 area.
Mark

Gold Play off EMA's More Bearish than NotUsing EMAs 13-34-89 Strategy, we see a solid hold on 34day. A break below could run down to 89day especially if markets continue bullish. Below im open for weekend swing SHORT. Closes friday above 34day small bullish position swing over weekend. 9-5-19

GLD (Wkly) Bear Deep Crab w/ ML setPrice sets up a Deep Crab as it is interacting with the upper Median Line. TP1@.236 TP2@.386

Gold analysis September 2019Pitchfork. If the futures do not gap the resistance Tuesday morning I will be shorting near market open.
My other charts I posted recently don't agree with this one.
My assumption is it will be gapped over resistance.
Unless it is going to sell off with market this week.
Which the way the global economy looks I doubt.
But every time every indicator says sell trump pulls a magic tweet out of his hat.
Will be on stand by looking for a direction to go with this.

GLD: SPDR Gold TrustM timeframe long-term BULL
W timeframe overbought mid-term BEAR
D timeframe overextended short-term BEAR
SUPPLY price reached suppy zone short-term BEAR
CORRECTION 50% fib retracement short-term BEAR
RSI overbought short-term BEAR
MACD divergence turning negative short-term BEAR
EXPECTED INFLATION after rate cuts long-term BULL
GDX short interest increased BEAR
GOLD/DXY ratio decreasing short-term BEAR
GLD shares otstanding decreasing BEAR
TIP lagging behind GC1! futures NEUTRAL
EXANTE is a broker for professionals. Direct access to over 50 financial markets through one account.
Stocks & ETFs, Currencies, Metals, Futures, Options, Funds, Bonds, Cryptocurrencies.
Any information contained on this website is provided to you for informational purposes only and should not be regarded as an offer or solicitation of an offer to buy or sell any investments or related services that may be referenced here. Investing in certain instruments, including stocks, options, futures , foreign currencies, and bonds involve a high level of risk.

Should you buy GOLD? Is it a good hedge?GOLD broke out of multi-year resistance in August of 2019
Showing extreme strength
Recently ran into secondary resistance of around $142-$144
If we surpass $144, GOLD can see levels it hasn't seen since 2011
Between 2011-2012, GOLD traded between $150s-$180s.

$GLD shortGLD has hit major resistance around $145. In addition, it is forming a shooting star on the weekly chart.
After three months of green weeks, GLD is definitely due for a correction.
It will likely find support around $136


Is gold going parabolic?After finally breaking out of this massive symmetrical wedge is gold now going parabolic? There is a lot of fundamental drivers for gold ranging from global concerted central bank easing, that is quickly turning into a currency war, add to this a trade war slowing growth, and increasing geo-political risk.
