double bottom double bottoms on XPEV
going long till 20$
all EV and Chinese market going to correct the huge drop
9868 trade ideas


XPEV XPeng Inc Options Ahead Of EarningsLooking at the XPEV XPeng Inc options chain ahead of earnings , i would buy the $10 strike price Calls with
2023-3-17 expiration date for about
$0.76 premium.
If the options turn out to be profitable Before the earnings release, i would sell at least 50%.
Looking forward to read your opinion about it.

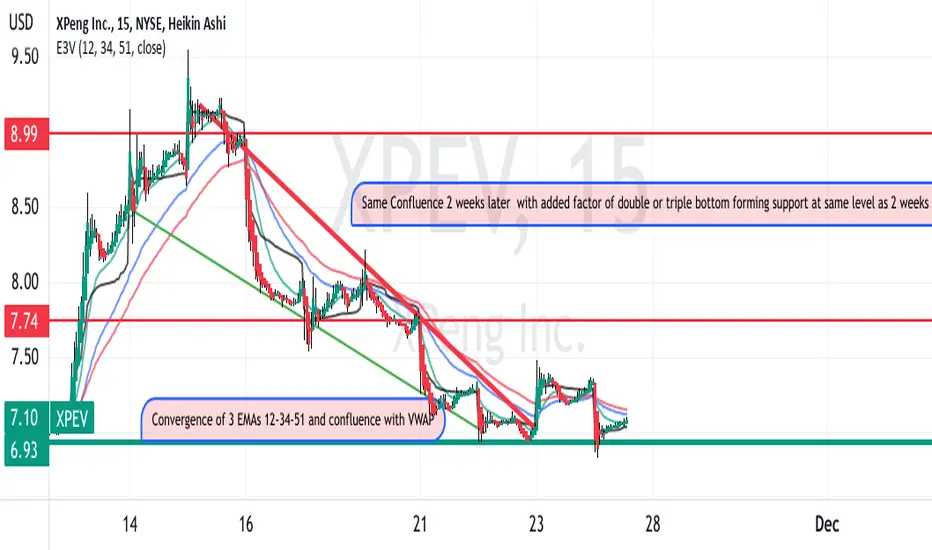
XPEV is forming a reversal pattern perhaps following TSLAXPEV is presently finishing out a falling wedge pattern.
As shown on the 30-minute chart, exponential moving averages
are falling and converging in the narrow area where VWAP
is trending. At lower time frames a "Golden Cross pattern"
A stop loss can be set under the double or triple bottom
with a target being the 1/2 of the way to swing high about 10% higher
based on a routine retracement. This seems to be a quality
swing long setup based on a breakout of a falling wedge
and a confluence of moving averaged and anchored VWAP
I took some call options with a strike of $ 8 and an expiration
on 12/16 while expecting over 100 % profit.
down trend line breaksdown trend line breaks out 1st target 14 and snd as labeled stop loss 8.0 ...
good luck...

Wyckoff Accumulation in XPEVPreliminary Support (PS)
The first significant rally that occurs after a prolonged decline that indicates budding demand showing up. It is usually associated with a minor panic preceding that rally.
Selling Climax (SC)
A major panic that occurs at the end of a steep decline in prices. In its classical form it is typified by large range reversal in prices accompanied by large volume.
Automatic Rally (AR)
The rally that occurs after a Selling Climax. It occurs without previous preparation, hence the word “automatic.” The top of an AR usually marks the beginning of the coming creek.
Secondary Test (ST)
A name given by Wyckoff to the reaction following Automatic Rally, (or rally following the Automatic reaction.) If that test is associated with small range and light volume—it increases the likelihood that the previous trend is over.
Spring
A form of a test of a trading range. Characterized by pushing prices below support by the CM in order to check the status of supply. The market’s response to the spring indicates the nature of supply and demand forces for the near future.

3 rising valleys. Fib target is up there.This is a bullish stock pattern - 3 rising valleys - and will explode soon. #Long

Is this a PIVOT point for XPEV?NYSE:XPEV
XPEV looks like it ready to pop. We can't be that much more before we get a big move up!

XPEV major trend shiftflying cars are the future guys. The technicals show a bullish reversal here
accept it.

Falling Wedge Pattern Falling Wedge in XPEV!
It's important to wait until it breaks CLOSING above the resistance trend line. Be patient and you could get a bullish trade with high risk/reward ratio!
SL: All time low
TP: $12, if TP hit, you could use trailing stop, and get a even better trade!

XPEV AnalysisPrice failed to hit the bearish POI at 12.86 before going lower, but it still played out well according to my analysis. Price is not playing out according to the wyckoff accumulation schematic as analyzed for the past few months, and is currently on a downtrend. I'm expecting price to make a bullish retracement back into the bearish POI at 12.86 before continuing lower.

Falling Wedge XPEG1. Falling wedge on weekly timeframe. Potential breakup.
2. WT_LB and CM_Williams_Vix_Fix indicate potential oversold position.
3. Based on sample of accumulated population data such combination of variables work out in 86% of cases.
4. Potential range for starting position accumulation.
5. Compared against NIO and LI. Relatively oversold position.
Just my thoughts. Do not trade on it. Not financial advice at all.

XPEV AnalysisPrice is currently on a downtrend. I was expecting a spring to be made here according to the Wyckoff accumulation schematic. This idea has been invalidated. Right now, we should be looking at a continuation lower after a bullish retracement to mitigate the bearish POI at 12.86.

$XPEV - Is it done selling?What an absolute disaster! I thought 15.40ish area would provide a good support but it provided a day of relief that traps a lot of bulls. How wrong I was to think that it was a good support.
The only next area of support left is $10.54. And it's a weak support and if it fails, $4.30 is next. Let's hope it doesn't happen.
The stock has been bouncing around oversold area more than a month (since 08/23/2022). Bullish divergence showing in MACD and RSI. Stochastic is still bouncing around in oversold territory.
Bearish target1 - $10.54
Bearish target 2 - $4.30
Bullish scenario - bounce from $10.54 and retest 15.44. area.
Disclaimer: Not investment advice.
If you like this post, follow me and subscribe to my posts for more technical analysis charts.

XPEV | Triple Divergences| Great EntryXPeng Inc. designs, develops, manufactures, and markets smart electric vehicles in the People's Republic of China. It offers SUVs under the G3 and G3i names; four-door sports sedans under the P7 name; and family sedans under the P5 name. The company also provides sales contracts, maintenance, super charging, vehicle leasing, insurance agency, ride-hailing, technical support, automotive loan referral and auto financing, music subscription, and other services. XPeng Inc. was founded in 2015 and is headquartered in Guangzhou, the People's Republic of China.
I still use dollar cost averaging as a way to minimize risk and guarantee a good return. Patience is required in this process.
Dollar-cost averaging is the practice of systematically investing equal amounts of money at regular intervals, regardless of the price of a security.
Dollar-cost averaging can reduce the overall impact of price volatility and lower the average cost per share.
By buying regularly in up and down markets, investors buy more shares at lower prices and fewer shares at higher prices.
Dollar-cost averaging aims to prevent a poorly timed lump sum investment at a potentially higher price.
Beginning and long-time investors can both benefit from dollar-cost averaging.
Not financial advice. Always do your research!

XPEV - Middle BounceXPEV is in a bearish state but that could change quickly as price hits the middle line of a dominant bearish channel
Previously this line has been as a point of support, twice (double bottom)

XPEV - Just an observation (short?)As per the chart,
XPEV making new all time lows.
Retest & reject of move above previous ATL could see a good RR set up.
Very tight stop.

XPEV AnalysisPrice has consolidated last week. No changes to my expectations this week. Right now, price is making a spring according to the Wyckoff accumulation schematic. From here, I'm expecting price to break market structure to the upside. If the bearish POI at 18.18 holds, then we should be looking at a downtrend, invalidating the Wyckoff accumulation schematic.

XPEV, We need to be careful now !What is the most probable scenario for XPEV?
XPEV's move from 22.73 to 47.98 has recovered 50 % of its major drop from 74.49 to 22.73. Mentioned drop is showing a remarkable 5 down going waves which can be labeled as wave A. ( wave 1 is also possible but we skip this alternative for now). last up going wave ( from 22.73 to 47.98 ) can be just wave A of B which means there may be another up going wave ( Wave C of B) after a correction down to 35, 32 or even 28 USD ( Wave B of B) corresponding to 50 % , 61.8 % and 78% Fibo Retracements respectively. Possible targets for next possible up going wave are shown on the chart. Please note that whole correction ( in the case of having a large ABC correction) may end at 13 USD !. Also, we need a trade below 39.71 to be confident about having at least a correction down to mentioned support prices.All these explanations are briefly shown on the chart.
Stochastic and RSI indicators are showing a bearish divergence with price which could be an strong bearish signal.
It is worth to note that stock may go down below last major low (22.73) without any additional up going wave ( I think it has low probability) therefore, we do not go long without any strong bullish signal in proposed support prices.
I have to emphasize that in terms of timing, chart is just schematic drawing So I kindly ask you to disregard dates on the chart.
We always enjoy our trading? Don't we?

XPEV, Our Proposed Prediction on 6th Jul 2021 is still working !Are we market makers ? Of course not! Any hidden information we had? Of course we did not . How could we predict a stock path 7 months ago?
Is there still any doubt about possibility of Mid term and Long term prediction of a stock or the market?
First, lets look at what we saw on the chart seven months ago ! and our prediction :
Trading view's page of XPEV is full of long ideas and it is very difficult to see any bearish publication . How we could achieve such a success in prediction which is still valid after 7 months? Answer is by using ELLIOTT WAVES .
We do not claim that XPEV surely continuous it's path as we predicted, but at least we had a prediction which so far has been valid for 7 months. We did some similar successful prediction for SHOP, ETSY, SQ, BTC at ATH and so on. This publication is not for admiration for ourselves ( Of course we had also some painful failures ). It is to encourage others to start thinking about power of Elliott Waves.
As far as we know, Elliott waves is the only tool which enables us to make predictions . We provided some of our achievements here and in the related ideas. Surely you can find many more more more successful and powerful prediction made by famous Elliott waves masters .
Good Luck every one.

XPEV (XPeng Motors) Long IdeaIf the general sentiment of the market improves a little and moves towards correction, this Chinese carmaker will be a good option in the coming days.
Short to medium term strategy
The first Chinese carmaker to add an automated driving system.
Technical Bollish Engulfitg --> Await confirmation and enter.(breaking through the recent high candle)

XPEV AnalysisPrice is playing out according to my analysis. Right now, price is making a spring according to the Wyckoff accumulation schematic. From here, I'm expecting price to break market structure to the upside. If the bearish POI at 18.18 holds, then we should be looking at a downtrend, invalidating the Wyckoff accumulation schematic.

XPEV AnalysisPrice played out according to what was expected last week. Right now, if this is a Wyckoff accumulation schematic, we should see price breaking market structure to the upside. We also do see volume increasing on the last down move, unable to push price down. I want to see a break to the upside with volume for confirmation for longs.
