BABA INVERSE HEAD & SHOULDERSLooks Like BABA Has Put In An Inverse Head & Shoulders Pattern And Is Going To $113
9988 trade ideas

BABA AnalysisPrice has invalidated the bearish POI at 85.00. From here, I'm expecting price to continue higher into the bearish POI at 104.85 next. We could also see price potentially retracing back to the bullish POI at 78.85 as there are 2 fair value gaps to be filled.

cluster resistance is here, dangerous for longs! 😜there's RSI/Trend/SMA resistance here, rejection here and break of 82=new 52w low
break of trend resistance zone/100 pivot level = parabolic breakout
drop boost n follow for more, thx :)

ALIBABA downtrend finally broken It has been a really rough year for Alibaba. It was straggling to get out of that 12 months downtrend. It is finally out of downtrend. There is a small resistance around $90 zone, once we break that, $103 will come so fast. I tried to make the chart so simple so everyone can understand. You are welcome to argue but pls be respectful. Enjoy

Alibaba Analysis 30.11.2022Hello Traders,
welcome to this free and educational analysis.
I am going to explain where I think this asset is going to go over the next few days and weeks and where I would look for trading opportunities.
If you have any questions or suggestions which asset I should analyse tomorrow, please leave a comment below.
I will personally reply to every single comment!
If you enjoyed this analysis, I would definitely appreciate it, if you smash that like button and maybe consider following my channel.
Thank you for watching and I will see you tomorrow!

Covered call on BABA againBAG HOLDING on this one for sure. But I do believe the bottom is in. IT SHOULD BE. Looking to continually lower my dollar cost average by chipping away. I actually wouldn't mind being called away at $120!
Could be a GREAT trade, even if you are new to getting into this stock. I sold the January expiration and got filled at $1.20


Alibaba Play with a Monsterjust made this chart to show you how it's easy to predict normal Strong Stocks in comparison with Cryptos.
Everything is just matter of time and patience, buy at the good time, and not be too greedy on your % returns.
Alibaba is a giant, it's very difficult to lose money for a long term investment..
-------------------------------------------
Trading Parts :
-------------------------------------------
Buy Zone : 210$ ish
Tp1 - 260$
Tp2 - 275$
Tp3 - 295$
-------------------------------------------
Happy Tr4Ding !

BABA AnalysisPrice play out nicely after taking the lows at 59.59 and rally towards the bearish POI at 85.00 during earnings. From here, I'm expecting a bearish retracement at least into the bullish POI at 69.80.

$BABA with a Bearish outlook following its earnings #Stocks The PEAD projected a Bearish outlook for $BABA after a Negative over reaction following its earnings release placing the stock in drift C with an expected accuracy of 50%.

BABA, 10d+/-35.28%falling cycle 35.28% more than 10 days.
==================================================================================================================================================================
This data is analyzed by robots. Analyze historical trends based on The Adam Theory of Markets (20 moving averages/60 moving averages/120 moving averages/240 moving averages) and estimate the trend in the next 10 days. The white line is the robot's expected price, and the upper and lower horizontal line stop loss and stop profit prices have no financial basis. The results are for reference only.

Options Ahead of EarningsLooking at the BABA Alibaba Group Holding options chain ahead of earnings, i would buy the $85 strike price in the money Calls with
2022-12-16 expiration date for about
$3.79 premium.
If the options turn out to be profitable Before the earnings release, i would sell at least 50%.
Looking forward to read your opinion about it.

ALIBABA downtrend finally broke aboveALIBABA downtrend finally broken. Alibaba managed to break above that huge wall that we had around $75. Now we China ease and decent earnings, i can see Alibaba shot up to $103 area in a short time. Made this chart as simple as I can for other to understand. All disagreements are welcomed :)

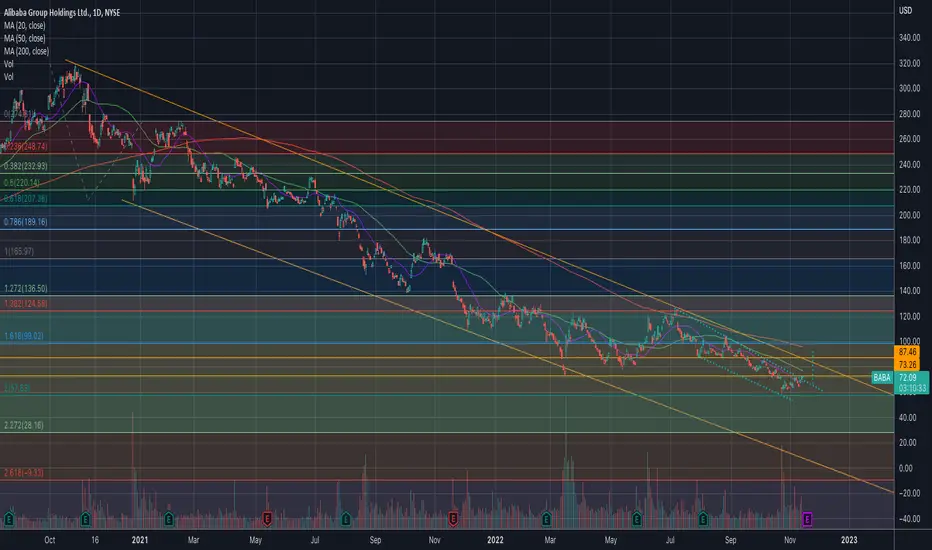
$BABA 2 year downward channelShort setup or finally breakout of this? Next couple of weeks very important

$BABA - potential breakout from down trend channel #BABA has been in down trend channel. It is currently breaking out of shorter timeframe descending wedge inside the long term downtrend channel. Price breaking above $73.50 is bullish.
Target 1 - $80
Target 2 - $87.50
Target 3 - $93
Stop loss - $68
——
Trade is done when it hit one of the target or stop loss is hit.
Disclaimer: Trading note. Not an investment advice.

BABA AnalysisPrice playing out exactly as analyzed last week. Price mitigated the bearish POI at 70.52 and reacted to the downside. From here, I'm expecting a continuation lower, potentially taking the lows at 58.01 and the sell-slide liquidity along the way.

"Bottom fishing BABA"? wait a sec
This is the day that I started to say short BABA at highs, Oct 28th
Even today, after Chinese tech names rebounded from the lows, still worse than what I expected. I hope its clear enough on my chart.
Just simple research, you will see a lot of analysis saying that "BABA is The Time For Bottom Fishing" or "Alibaba Stock Could Potentially Double In 2023". I never doubt for BABA's efficiency or its fundamental. Something that makes me truly worried about is China's political environment. Even China change its zero-COVID policy, does that will make company like BABA better off in China? I am still question that.
As old says, the market doesn't care who you are, how smart you are, what degrees you are, how much money you have, how highly you are placed socially. The market will do whatever it "wants" to do, rewarding lavishly those who surrender to it, yield to it, and follow it, and punishing severely those who argue with it, fight it, and go against it. There are still a lot of analysts saying to "bottom fishing" BABA, if this is real Bottom for BABA, or risk free area, I will put every single penny in my pocket into this trade. Will they do as what I said? Possibly No.
Therefore, nothing needs be worried about here, I will keep SHORT the highs.

ALIBABAThis is my analysis of this stock, and I hope you will take it into account. I wish you much success.

BABA butterfly I think I said back in 2021 I'd buy BABA under 70. People laughed at me at the time not thinking it'd go to 70. The way the market works, people will probably laugh now when I say it because it's down under 70.
Butterly pattern. Gives tight stop area and is how a lot of lows are made.

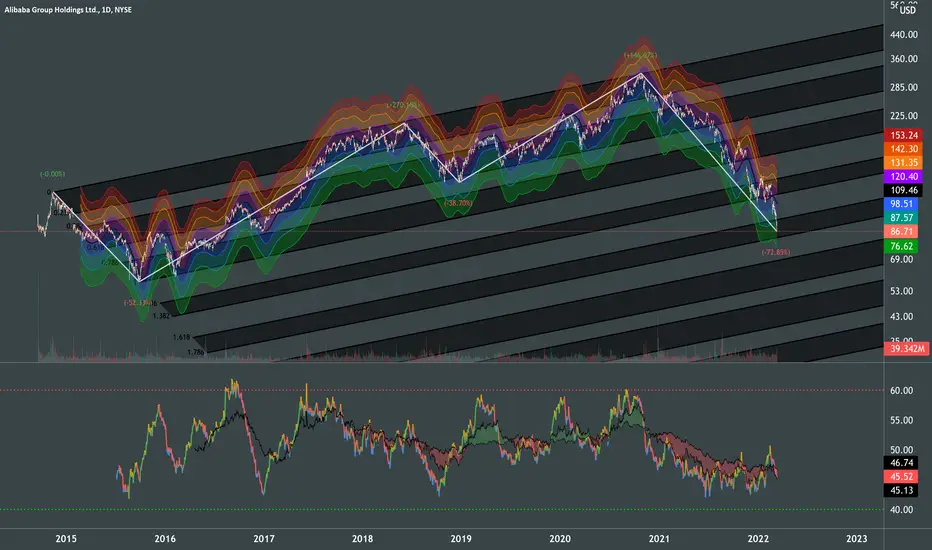
$BABA OversoldAli Baba is being under intensive sale. Almost 2 years of downtrend has pulled the prices to demand level.
At this point the current prices will attract capital from a wave of the long-term investors, which will result in market reversal, especially for this size of a company.
For now expecting a pullback as a reaction to 72% decline.
The more it falls, the move powerful will be a movement to opposite direction.
BABAThe parabolic descending trend, which started from the all time high, has brought the price very close to the all time bottom. Adx may have given the first signal of a trend reversal.

BABA bullishReally hard to not love BABA at these levels, especially looking longer term. If US markets to continue their bearish path, I'm not sure that baba would decouple from that sell pressure; however, it should be noted we are at generational support and its worth picking up some stock or leap calls. I think we should see some significant upside from here in time.
