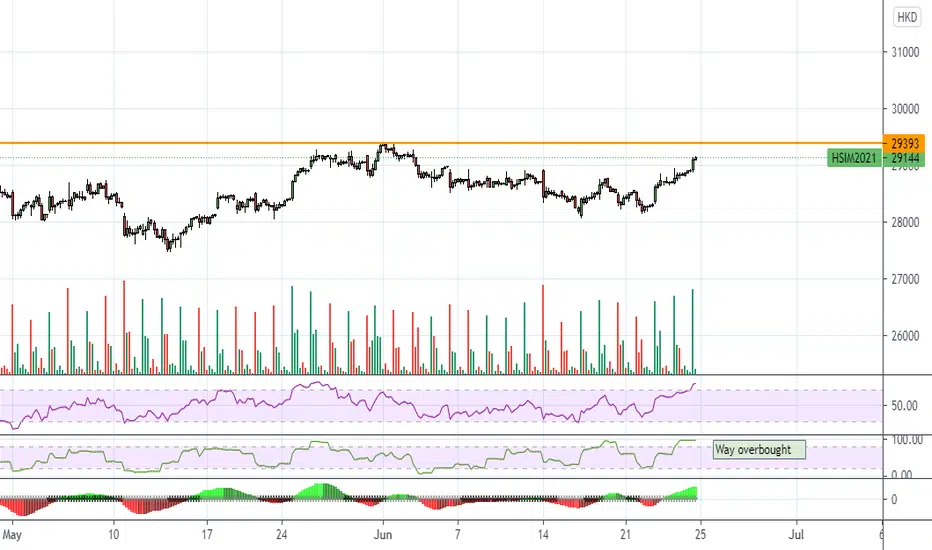
HSI OverboughtHmm. Overbought on the RSI into resistance? On the other hand China just cut the reserve requirements. Bearish at the moment but could see more upward movement.
HSI1! trade ideas

HSI DailyDaily RSI went oversold so it got a bounce, but I think there's further downside because their own government keeps crushing various stocks.
I don't think Xi gives a rat's ass about the stock market any more, obviously he's trying to squash billionaires. It's supposed to be a communist country, after all.
Also, Xi WILL invade Taiwan while Biden is in office. He's made that a goal, and he's 68 so he knows he doesn't have a lot of time left to leave his legacy. If only there was a way to get inside info on WHEN, you'd make a killing with EWT puts. Maybe he does it to celebrate his 70th birthday in a couple of years, no real way to predict....
Anyways, see the highlighted peak, expect a similar whipsaw down.

HSI at the edge of the cliff
HSI broke 28130 eL, if it can not recover this position at today's trade, then it may very likely sink forward Fib 0.382 @ 27347.


HANG SENG INDEX Will Go Down! Sell!
Hello,Traders!
HSI is trading below a strong horizontal resistance
That was established 4 months ago
And once the index retested the level
We saw a nice bearish reaction
Given the renewed lockdowns in some parts of China
Together with the 2nd biggest port brought to a halt
And the persistent news of the Radioactive leak In the Southern Provinces
The sentiment isn't optimistic
And the date on sales of cars and smartphones China confirms that
All of that combined make a bearish correction very real
And the target is near the previous low that stands at -4%
Vis a vis the current levels
Sell!
Like, comment and subscribe to boost your trading!
See other ideas below too!


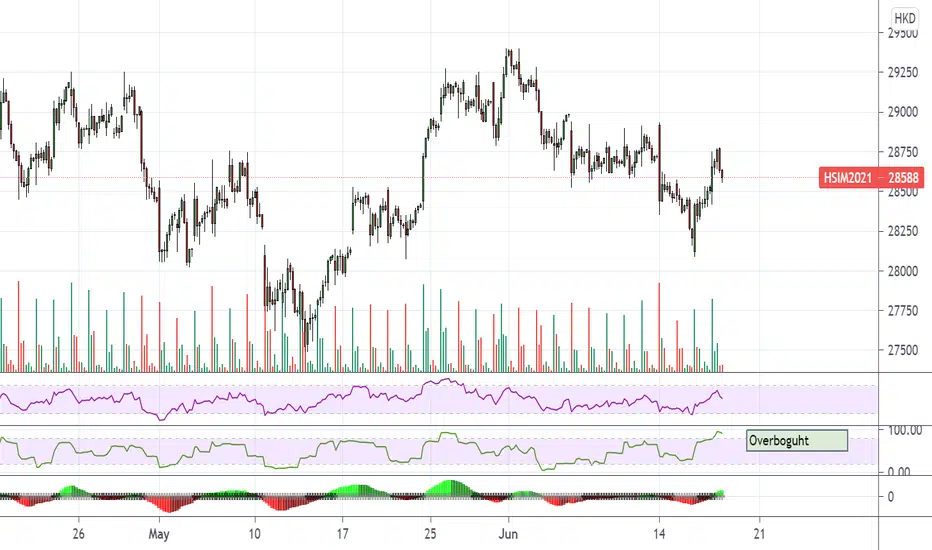
HSI way overboughtMight hit resistance line though
The other interesting thing is taht they're not pumping US futures much

HSI Hit Oversold yesterdayHSI hit oversold on both my 3 hr and daily charts, I doubt it gets too pumptarded because their government is keeping everything in check, but you figure a one week rally or so. That's why I'm not shorting Chinese ADRs today.

HSI OverboughtHSI is still overbought on MFI, I expect it to drop next week. China seems a day or two off from the rest of teh world. Grabbed some PDD puts on this morning rally.
HSI1! 2021 June 21 Week (Intraday)
HSI1!
HSI1! 2021 June 21 Week (Intraday)
Market has made lower high and we can now visualize a down channel.
Intermittent support at 28441.
Scenario:
1) Short opportunity if price returns to test 28751 - 28655 region
2) Wait for price reaction at red/green zone before taking position.

HSI Expecting Bullish Trend Continuation HSI broke above its downtrend line with positive momentum and positive flow.
HSI is expected to trade towards 261.8% Fibo level at 27950-28000 level.
A break below 26,500 level will falsify the analysis.

Buckled up for the Roller-coaster June
As always, to read in junction with my previous analysis with link above is advised.

HSI1! 2021 June 14 Week (Intraday)
HSI1!
HSI1! 2021 June 14 Week (Intraday)
Weekly, Daily = Bullish | H4 = TBC
Past 7 days in rotation. rotation range zones trade levels remains.
Bar 2 and 3 are weak.
Red/Green zone = preferred entry

HSI1! 2020 May 31 Week (Intraday)
HSI1!
HSI1! 2020 May 31 Week (Intraday)
Weekly = TBC | Daily = TBC | H4 = Bullish H1 = price rotation
Bar 1 = weakness, no result from effort
Bar 2 = Upthrust = weakness
Bar 3 = reversal = weakness
Red/Green zone = preferred entry
Immediate support = 28942
If price continues to peel away from the supply (upper line of the channel,
means upward momentum may be weakening / pausing.


HSI1! 17 May 2021 Week (Intraday)
HSI1! 17 May 2021 Week (Intraday)
Weekly = TBC | Daily = Bearish, H4 and below = Bullish
Green zone target was reached last week, and market broke down and reach for the lower green zone.
Market is still making lower highs and in a downtrend, so prefer to short on test of the below levels
Scenario
1) Market may attempt to close gap
2) Short levels 28753 / 28565 / 28231
Have a good trading week ahead.

HSI1! 10 May 2021 Week (Intraday)
HSI1!
HSI1! 10 May 2021 Week (Intraday)
Weekly | Daily = TBC, H4 and below = Bullish
03 May Week - Rejection scenario played out and green zone price target was reached.
After which Bar A dominated the market. The low volume wide spread down bar test of its low at A1 offered good long opportunity; and later climatic bar B as well.
Notice how the demand line of a previous channel (grey) acted as a resistance with the highs tracing that line.
Will market attempt to return to previous channel?
Scenario:
If 28663 is accepted, price may attempt 29820.
Else we may again see green zone as price target.
Have a good trading week ahead.

BUY at the opening of this market high probability for hsi to hit resistance as a target buy the market at the opening

HSI1! 03 May 2021 Week (Intraday)
HSI1!
HSI1! 03 May 2021 Week
Weekly = Bullish, Daily = Pending, H4 and below = Bearish
Market was within the 29252 - 28440 range
Market currently is oversold as it went below the channel at the moment.
Market may attempt to return to the channel
Scenario:
Acceptance into channel price may try 29200
Rejection: the green zones may be the price target.
Have a good trading week ahead.

Hang Seng bounce off oversold?HSI went oversold last night, weird rangebound trading. Probably gets a bounce Monday/Tuesday which means a gap up.
Flipped my XPEV puts shortly after open.

HSI1! 2021 Apr 26 Week (Intraday)
HSI1! 2021 Apr 26 Week (Intraday)
It looks like price will try to reach for 29318 and
possibly attempt the resistance level.
Immediate support = 28426 - 28484
Immediate resistance = 29243
Entry preference remains at SR zones.
Remember to like and follow if you find this useful.
Have a good trading week ahead.
