HSI1! trade ideas

HSI1! 2021 Apr 12 Week (Intraday)
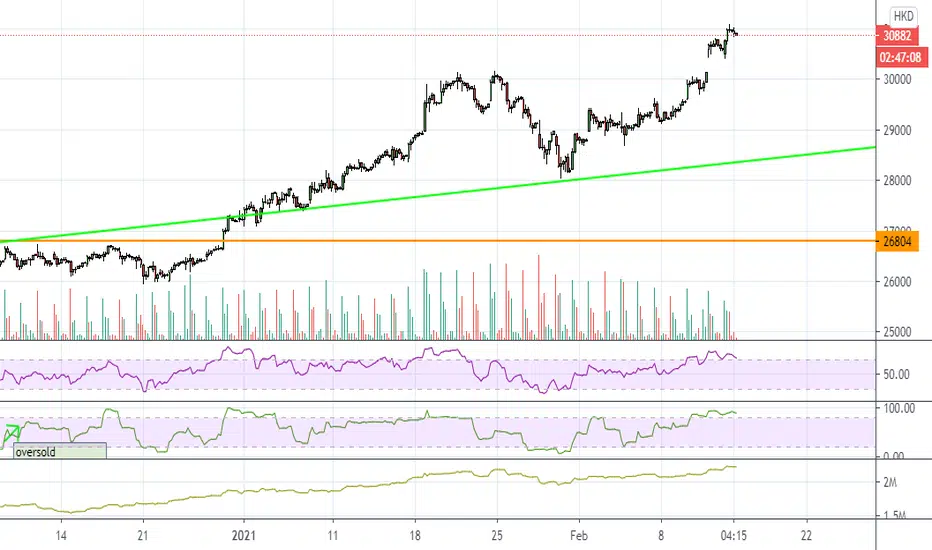
HSI1! 2021 Apr 12 Week (Intraday)
Bar 2 came down to test supply of Bar 1, and closed off its low.
Price may come back down to test for supply again before moving up.
Will wait for a reversal pattern, preferably at the supply line of the
channel, to long.
Or green/red zones cab be entry zones as well.

HSI1! 2021 Apr 05 Week (intraday)
HKEX:HSI1!
HSI1! 2021 Apr 05 Week (intraday)
Daily = bearish | H4 = bullish / H1 = bullish
Last week's short on test of high was only good for 29 Mar as
resistance turned support, after which we had to recognize and
adopt a long strategy.
Demand has weakened, foreseeing the holiday.
Strategy remains that green/red zones remain the preferred entry levels
Like and follow if you find this useful.
Have a profitable trading week.

HSI UpdateHong Kong went overbought and immediately started selling off after their lunch break. Japan and Australia down big, Asia off to a bearish start this week.

HSI1! 2021 Mar 29 Week
HSI1! 2021 Mar 29 Week
Daily / H4 = bearish
H1 = bullish
Price came down to support last week
Cognizant of the downtrend, prefer to short on test of high.
Like and follow if you find this useful.
Have a profitable trading week.

HANG SENG INDEX FUTURESMy first recommendation concern this market was successful so yes sell this market again

Every stock is down Currently every stock on the Hang Seng is down and things aren't really looking like it getting better.
Wonder how this will translate to the other asian equity markets and global as well.
This is in a nice downward channel and wonder if it will break the bottom trend line to move further down.
Thats all folks

HSI UpdateWow, China and Japan went on a full out tank with another 2% drop tonight, didn't see that coming.
I though Asia was gonna go up tonight, but at least this explains the afternoon drop in the US market. They dumped US futures on high volume before they tanked their own market.
Oversold again, but I think tehy turned their algos off.

HSI : Expecting a slight pullback before next accelerationExpecting some braking at around 27430 to 27200 level. Prior to that, a slight pullback to ellipse area before gushing down to 27430 to 27200. Let's see what happens in that price region (consolidation /accumulation?) then zoom another leg to 26940 region as a false break? Let's monitor...

HANG SENG INDEX FUTURESI well studied about the futures market and this is my first recommendation concerns this market, I hope tp sl points are clear.


HSI1! 2021 Mar 22 Week
HKEX:HSI1!
HSI1! 2021 Mar 22 Week
Red/Green zone = preferred entry
H4 = price rotation
Daily / Weekly = bearish
Levels unchanged. Ultra high buy volume came 1, but are these to distribute?
Bar 2 sell doesn't yield result compared to previous down bars.
So either we continue to see price rotation or there may be long opportunity.
Remember to Like and Follow if you find this useful.
Have a profitable trading week ahead.

history doesn't repeat itself but it rhymesRight now it comes to half of March and the roller coaster has been running all the way down to around 28500-29500, with big shake from session to session.
Have got a feeling that market will be set to kill the volatility bulls for the coming couple of days, before it decides which way to go (downward then most likely).
From day chart, interesting analogised pattern was spot.

HSI1! 2021 Mar 15 Week
HSI1! 2021 Mar 15 Week
Red/Green zone = preferred entry
W = Bullish / D = bearish
Last week' range bound within Bar1 1's low and Bar2's high provided some nice rotation play.
Bar 3's upthrust was perfect for short.
Not much has changed in the levels. Likely still rotation play or just maybe, we will see a
breakout to the down side?
Remember to Like and Follow if you find this useful.
Have a profitable trading week ahead.

Testing for scriptingstrategy(
"EMA Cross Strategy",
overlay=true,
calc_on_every_tick=true,
currency=currency.USD
)
// INPUT:
// Options to enter fast and slow Exponential Moving Average (EMA) values
emaFast = input(title="Fast EMA", type=input.integer, defval=10, minval=1, maxval=9999)
emaSlow = input(title="Slow EMA", type=input.integer, defval=50, minval=1, maxval=9999)
// Option to select trade directions
tradeDirection = input(title="Trade Direction", options= , defval="Both")
// Options that configure the backtest date range
startDate = input(title="Start Date", type=input.time, defval=timestamp("01 Jan 1970 00:00"))
endDate = input(title="End Date", type=input.time, defval=timestamp("31 Dec 2170 23:59"))
// CALCULATIONS:
// Use the built-in function to calculate two EMA lines
fastEMA = ema(close, emaFast)
slowEMA = ema(close, emaSlow)
// PLOT:
// Draw the EMA lines on the chart
plot(series=fastEMA, color=color.orange, linewidth=2)
plot(series=slowEMA, color=color.blue, linewidth=2)
// CONDITIONS:
// Check if the close time of the current bar falls inside the date range
inDateRange = (time >= startDate) and (time < endDate)
// Translate input into trading conditions
longOK = (tradeDirection == "Long") or (tradeDirection == "Both")
shortOK = (tradeDirection == "Short") or (tradeDirection == "Both")
// Decide if we should go long or short using the built-in functions
longCondition = crossover(fastEMA, slowEMA)
shortCondition = crossunder(fastEMA, slowEMA)
// ORDERS:
// Submit entry (or reverse) orders
if (longCondition and inDateRange)
strategy.entry(id="long", long=true, when = longOK)
if (shortCondition and inDateRange)
strategy.entry(id="short", long=false, when = shortOK)
// Submit exit orders in the cases where we trade only long or only short
if (strategy.position_size > 0 and shortCondition)
strategy.exit(id="exit long", stop=close)
if (strategy.position_size < 0 and longCondition)
strategy.exit(id="exit short", stop=close)

HSI OverlayI threw together this overlay a few days ago and didn't believe it because I figured Asia was gonna pump but it looks like they're gonna whipsaw sideways for a while.
Oddly this indicates either a Monday or Tuesday pump, lol.
They appear to have lost interest in tech again, NQ is the only index red (by a little)

HSI Long entry setup could be approachingEntry, exit and R:R shown in chart.
Hopefully will get triggered in.
2 trades will be taken and then managed accordingly.
Good luck!

HSI1! 2021 Mar 08 Week
HSI1! 2021 Mar 08 Week
Red/Green zone = preferred entry
Grey zone = price rotation, entry opportunities on breakout of zone
M / W/ D = bearish
Demand was present at bar 1, however no evidence of change in trend since
market is still making lower highs.
Will prefer to keep on the short side.
Remember to Like and Follow if you find this useful.
Have a profitable trading week ahead.

Hang Seng UpdateThese Chinese people are funny, they're alternating red and green days, lol. Trying hard to go green today so the pattern stays consistent.

HSI1! 2021 Mar 01 Week
HSI1! 2021 Mar 01 Week
Red/Green zone = preferred entry
What a mighty down move from 22 Feb's alert on selling.
On daily chart we see some buying, however note the low volume on buy, so let's watch
on 01 Mar to see if more buy volume will come in to support.
Otherwise we can see 28078-28168 as test of previous support
Previous peak demand zone was at 26414.
Have a profitable trading week ahead. HKEX:HSI1!

Exhaustion Gap ConfirmedSell off finally came after a post-gap mark-up of approx. 600 pts to 31116, the third trading day after the exhaustion gap.

HSI1! 2021 Feb 22 Week
HSI1! 2021 Feb 22 Week
Red/Green zone = preferred entry
Selling has come in at A.
Would prefer to short if the highs are tested on lower volume,
Target can 30% / 50% / bottom of channel.
Have a good trading week ahead!

HSI overboughtChina has been pumptarded lately, waaay overbought.
Expecting China to go down and EUrope to go up. More whipsaw, staying out for the day since I made money on open.