HSI1! trade ideas

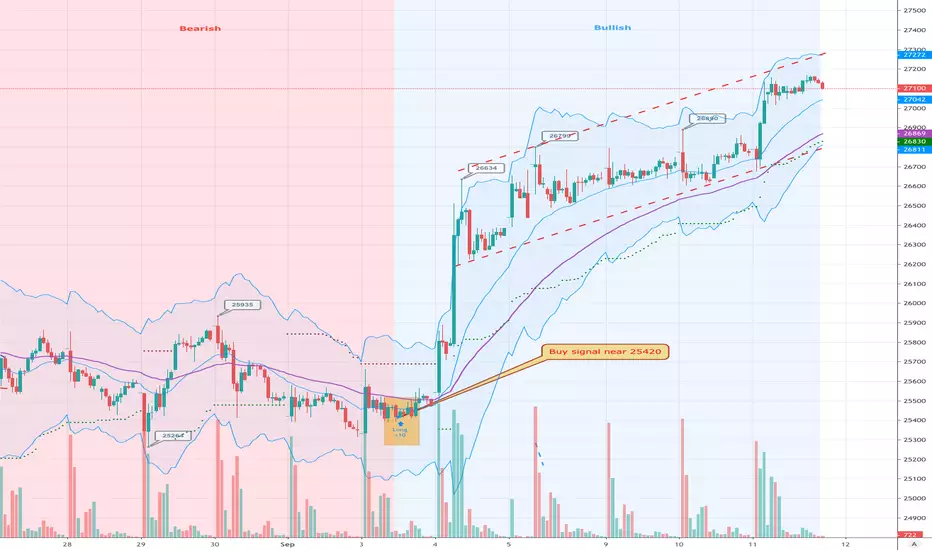
Recovery Rally For HSIHSI is likely to gap higher today amid delay of extra tariffs on Chinese goods. President Donald Trump said he was postponing the imposition of 5% extra tariffs on Chinese goods by two weeks, a move that delays the next escalation of the trade war and brightens the backdrop for upcoming trade negotiations.
“At the request of the Vice Premier of China, Liu He, and due to the fact that the People’s Republic of China will be celebrating their 70th Anniversary on October 1st, we have agreed, as a gesture of good will, to move the increased Tariffs on 250 Billion Dollars worth of goods (25% to 30%), from October 1st to October 15th,” Trump wrote on Twitter on Wednesday U.S. time.
S&P 500 futures climbed 0.5% and the offshore yuan strengthened 0.3% against the dollar. The yen fell.
IG HS50 gaps higher to 27464 session high... I guess 27500 upside target is likely to reach today, let's see...
-DevilTrader168


Bear Market Has Come...I concluded 8 crucial factors to determine the direction of the HK stock markets:
1. Tension of US-China Trade War: Negative
2. Inverted Yield Curve: Negative (Recession Worry)
3. Political Environment and Sentiment: Negative
4. Fed’s Dovish Tone: Positive
5. Leading Economic Data: Negative
6. Companys’ Earnings: Neutral to Negative
7. Liquidity and Fund Flows: Negative
8. RMB Depreciation: Negative
Trading Plan: Sell on every bounce until we see panic selling at heavily oversold level. Second wave of correction will happen on coming weeks or months. Be prepare!
HKEX:HSI1!
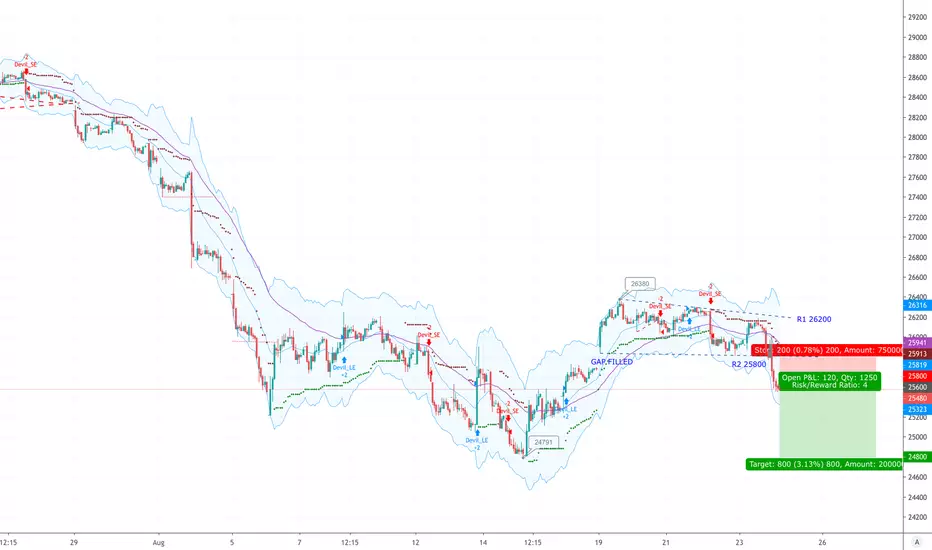
HSI Short: 5th wave downI am proposing to short HSI given that the risk is small right now and that price has stalled for the last 3 days at the price wave 1 end area.
The risk to reward is good now.


Update on Hang Seng Index Analysis on Weekly timeframeDuring last week, HSI has successfully broken 28,075 short term support level and dropped over 1,500 points to our target near 26,505. Currently, HSI is retesting the previous low at that level.
We are expecting the market to break the 26,505 structure level and if it does, we would be looking at a retest of structure in the lower timeframe for our entry. Potential target could be near the next low which is around 24,500.
Gordon @GoreStreetTrading
Previous Analyis

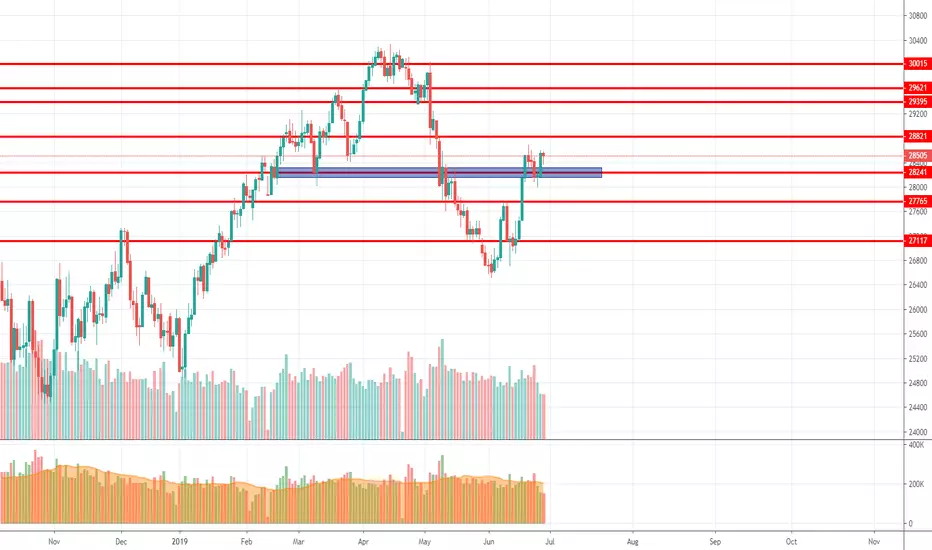
Hang Seng Index Analysis on Weekly timeframeHSI has retraced roughly 75% from the top 33,516 (January 2019) since the uptrend started on 28 December 2018. In April, we have seen HSI spike up to the 30,200 level where price was rejected. Recently, price has formed a short term support near 28,075 level since mid-June.
Price has now printed a higher low and a lower high which therefore is not clear where the market is heading in the long run. This means we need to see a breakout of either higher low or lower high to see a clear direction.
In the short run, we would expect the market to hold up near 28,075 level and try to push through the upper bound (downward trendline). If price could break and close above the most recent LH 30,220, the market may retest previous 31,500 resistance zone.
On the other hand, if we see price push and close below 28,075 short term support level, we would look for a short term retest on lower timeframe of 28,075 for a potential short position down to 26,700 (most recent low),.
The reason we have two possibilities is due to the current market conditions. We need to see a break out one way or the other to make a directional judgement.
Gordon @GoreStreetTrading

$HSI: Break down from pennant formationWith no Fed support and 1 tweet from Trump, $HSI has finally broken down from the pennant formation which is situated in the middle of a long-term channel pattern. With the breakdown, $HSI should be revisiting the lower boundary of the long-term channel at 19.8k over the medium term.
The Chinese will not bend over backwards to strike a deal with Trump whom they do not trust. Think opium wars and the ABCD encirclement of Japan pre-WW II. In Xi's mind, this is destiny calling, China's turn to stop the cycle of foreign oppression, the reason why he is President for life. Contrast that to Trump's transaction approach and cavalier attitude to tariffs.
When 941, 939, 3988 etc are breaking down from long-term support levels, it is time to get out dodge.


Hang Seng Futures at SupportUnless rate cut is by 50 basis points (unlikely), HS futures should bounce. US-China 'tensions' is just noise. There hasn't been news on that front since 2 weeks ago.

Confluence of coincidence: $HSILast Oct I published a series of charts named “The preponderance of evidence”, I think it is time for a new series. I think the charts itself should be self explanatory. Feel free to drop me a line on what you think.

Morning star on HANG SENG. 29 june Trading Idea. With Xi and Trump meeting this weekend, I'm expecting good news from them as the market close with a very bullish pattern. Going long here should be very rewarding as there is potential for upside than downside. 27910 will be our SL.


<TradeVSA> Pullback in Downtrend for HSI Futures?Signals in the daily chart:
1. Distribution with Up-thrust at the top
2. Sell-Off bar with high volume
3. Upbar to test the high of Sell-Off bar and resistance
Send us your preference stock to review based on TradeVSA chart by comment at below.
Disclaimer
This information only serves as reference information and does not constitute a buy or sell call. Conduct your own research and assessment before deciding to buy or sell any stock

Potential Harmonic PatterLong around 28,756 area with a stop-loss below previous low @28619, Target #1 @29020, Target #2 @29218

Double bull flag formed during today's session, 1:3 RRRPotential reversal targeting 29020 (29k figure) and 161.8 fibo extension @29,201-18, Pattern invalidates below 28,756
Trade safely, and never invest money you cannot afford to lose. This is not a trading advise or recommendation, trade at your own risk.
HSI, HSILONG, HSI1!, HSI2019, HK
