Copper Elliott Wave Idea - Bullish Cycle Started?Taking a look at something other than Crude Oil for a change.
It appears that Copper is out of a 10 year bear cycle and a bull cycle started in 2016.
A look at the beginning; you can see wave 3 hit the 4.618 extension of wave 1 perfectly and then corrected perfectly to the 0.236 level for wave 4 >
If you add in the subwaves of wave 5 there is also a nice 0.236 correction of wave 3 for wave 4 >
All that would suggest an impulse move up and 4.0505 was the end of a larger degree wave 1.
If you look at the following years from 2006 to 2016 it appears to be a multi-year correction in the form of WXYXZ > It completed at exactly the 0.618 level at 1.9300 >
Looking at recent time it looks as though the first impulse wave up is completed and now in the correction, possibly to the 0.618 retracement area before up for wave 3 >
A look at daily level we could be in wave B of Y > the 0.618 extension lines up nicely with the 0.618 retracement level.
Something to keep an eye on I think as it could turn out to be a nice long trade with a stop loss below 1.9260
LRC1! trade ideas


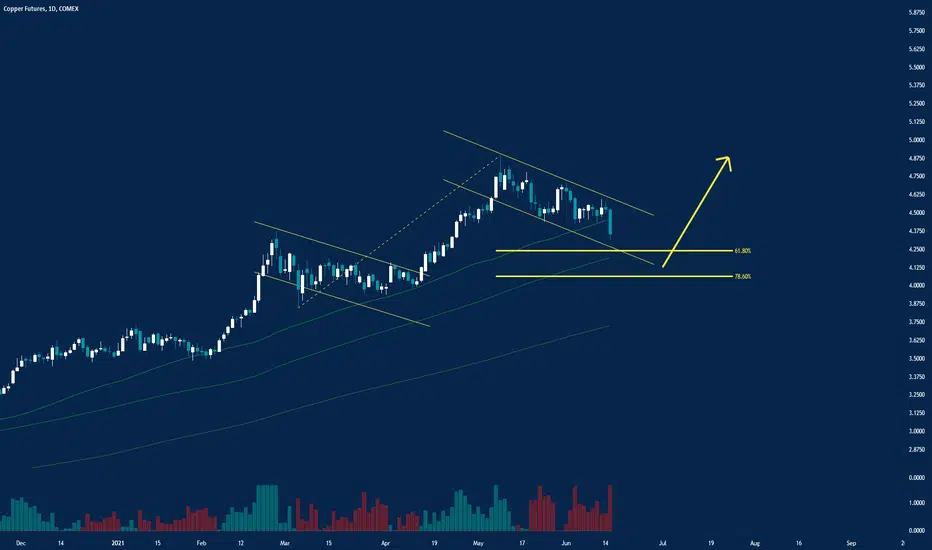
Copper well poised to resume its upword journey.Copper respecting channels and momentum built up to resume its up word journey. A close below 4.2945 would be a price point to reconsider my view.


Commodities - Copper Topped OutIdea for Copper:
- Commodities Cycle is topped out.
- Copper in Trade and Trend Distribution patterns.
- Clear 5 wave Impulse completed.
- Re-tested resistance and rejected.
- Price will bleed out to complete the Head & Shoulders then capitulate.
TP1: 3.44 very likely.
TP2: 2.78
PT: 1.97
Global markets are not moving back into Goldilocks, no matter what the media is blaring. Reflation Overshoot Trade is over. Exposure should be given to Stagflation and Deflation trades.
GLHF
- DPT

COPPER: PRICE DROP DOWN | WAITING FOR NEW BUY SCENARIO 🔔Copper prices fell on Tuesday, as increasing inventories in global exchanges and worries about possible governmental price control measures in top consumer China weighed on sentiment, despite data showing solid copper imports in the first quarter.
Three-month copper on the London Metal Exchange fell 0.1% to $8,856.50 a tonne by 0706 GMT , while the most-traded May copper contract on the Shanghai Futures Exchange closed down 0.3% at 65,870 yuan ($10,055.72) a tonne.
A rise in the prices of global commodities has led to Chinese top officials emphasizing the need to cap prices to reduce cost for firms and control inflation .
However, China’s January-March copper imports were the highest first-quarter amount since at least 2008, on rising demand and easing logistics issues.
“(There’s been) too much good news baked in, so much so that looking forward, there is expectation of tighter monetary conditions and (China’s) State Reserve Bureau’s release of supplies to help industrial firms cope with rising raw material cost,” said a Singapore-based metals trader.
“But I think this is a dip to buy anything between here and $8,800 is worth picking up,” the trader said, adding that data were backward looking.


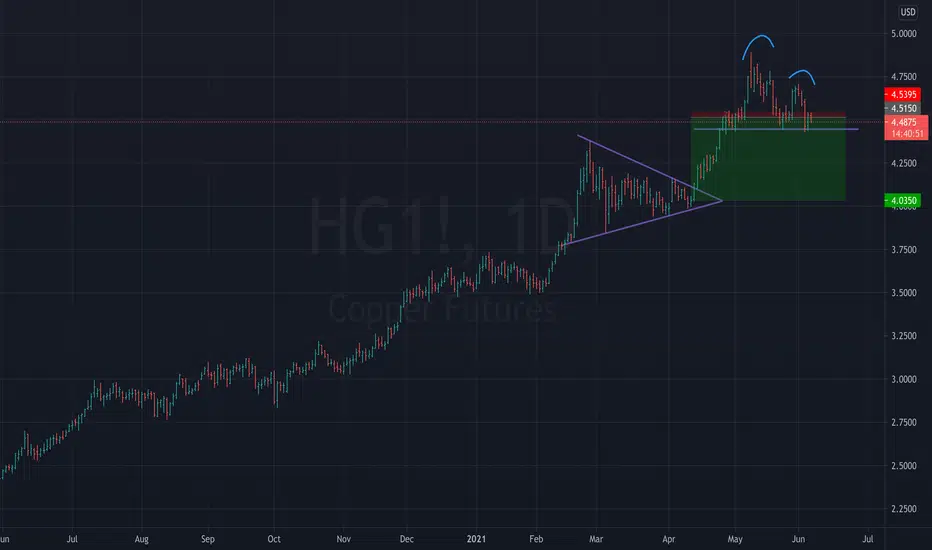
Copper Down Long TermThe recent record highs in copper seems to be quite over done.
Chart has formed a backward wedge of some sort, which typically reverses down.
Expect copper to slowly move south over the coming month to the 61% FIb level.


Falling WedgeIt was in a downwards trend, then found some support. Now downwards trend became downwards wedge, trade in wedge or wait for break.
Chart and moving average says to short for 8hrs to stay in the wedge pattern and retrace to the support line...


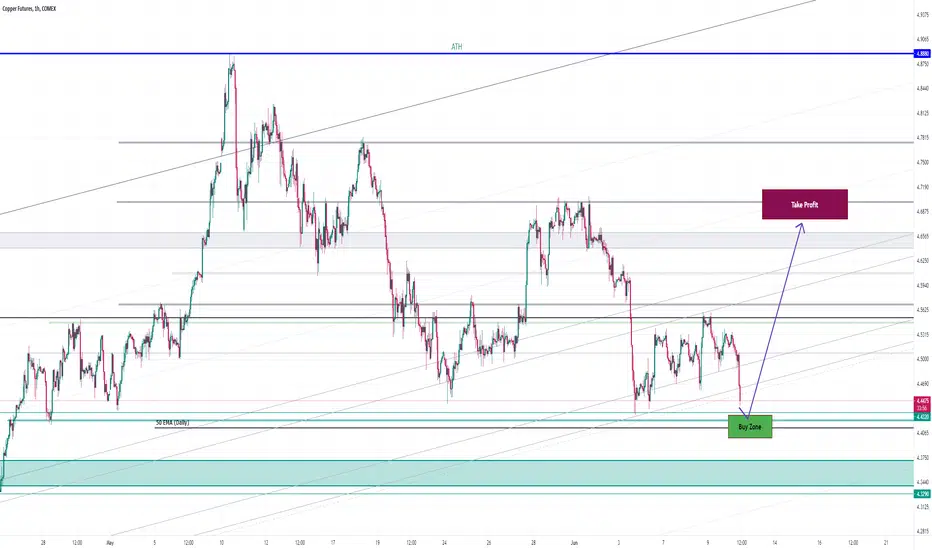
Time to Buy CopperCopper consolidated significantly after reaching overbought levels on weekly charts even. Now it has reached a very strong support level from where it should bounce back. I have decided to go long on copper from 3.45 and will ride it to the 3.65 levels. A good time to Buy Copper


Long /HG- Inside bar at neckline, followed by upward inside bar and a key reversal.
- Busted double top.


POSITIONAL LONG VIEW IN #COPPER MCX BO RE - TETS CMP 738 & 50 DMPOSITIONAL LONG VIEW IN #COPPER MCX BO RE - TETS CMP 738 & 50 DMA 738 65 HOLD CONTINUOUS 2 DAYS
MCX COPPER @ 742
STOP LOSS 725 ON CLBS
TARGET 750 762 772 781 793 712 +++ NEW HIGH

Detailed Elliot Wave Analysis of Copper with Predictions
The recent rally in Copper prices sure feels like a wave 3. Volume is great. In wave 3 according to RN Elliot is usually the most powerful wave in a trend. Prices rise quickly and corrections are very short lived and shallow. Anyone looking to get in on a pullback will likely miss the boat. As wave three starts, the news is probably still bearish, and most market players remain negative; but by wave three's midpoint, "the crowd" will often join the new bullish trend. Wave three often extends wave one by a ratio of 1.618:1. This is where we are at currently at 1.618. Looks to me this is the End of wave 3. Anyone looking to get in should wait for wave 4 to play out which will provide a very good risk reward trade. And according to RN Elliot research Wave 5 is the largest in the commodities.
Note - If wave 4 Monthly closed anywhere in the price range of wave 1 this idea is invalid
This is my preferred count of Elliot wave Analysis on Copper. It’s a logarithmic chart. So we had a 15.5 years long Ending Diagonal which ended with a explosive breakout. Followed by Double Combo WXY. W was an Expanded Flat with C Wave going deep testing the breakout point of the Diagonal. And then X wave correction in three waves marked abc. And then the y wave which is the larger trend finished higher than W which is unusual case. I have given the subwave count of wave 1.
Subwave count of wave 3 :
Wave 1 finished at median line of pitchfork
Wave 2 was a running flat correction
Wave 3 almost kissed the 1.0 line of the pitchfork
Wave 4 correction was a symmetrical triangle broke out in the direction of B wave. It also comply with guide of alteration.
And looks like we my have just ended subwave 5 and Main wave 3 as you can see in the chart it has made a lower low on daily timeframe
Thank you for reading
Will appreciate your feedback
