Copper Futures (HG1!), H4 Potential for Bearish DropTitle: Copper Futures (HG1!), H4 Potential for Bearish Drop
Type: Bearish Drop
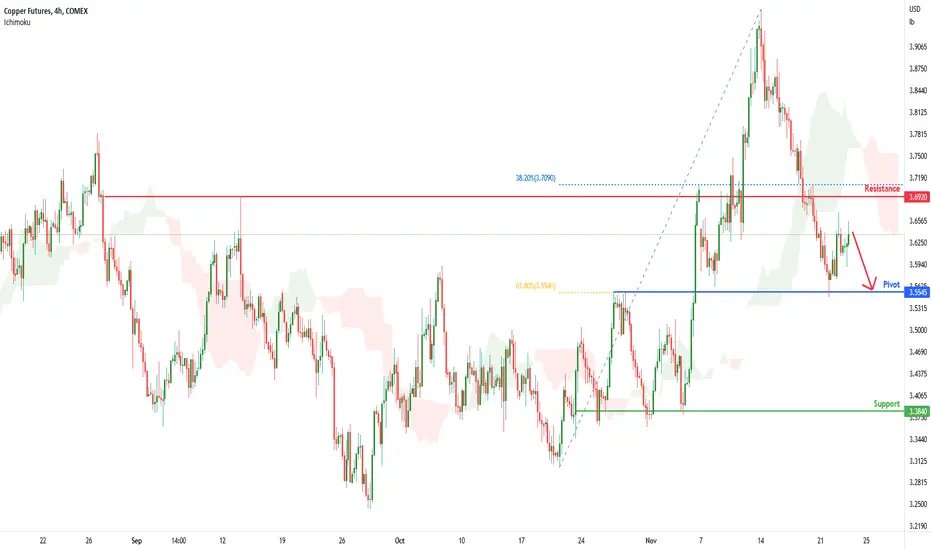
Resistance: 3.6920
Pivot: 3.5545
Support: 3.3840
Preferred case: On the H4 chart, we have a bearish bias. To add confluence to this, price is under the Ichimoku cloud which indicates a bearish market. If this bearish momentum continues, expect price to possibly head towards the Pivot at 3.5545, where the 61.8% Fibonacci line is.
Alternative scenario: Price may go back up towards the resistance line at 3.6920, where the 38.2% Fibonacci line is.
Fundamentals: There are no major news.
LUC1! trade ideas
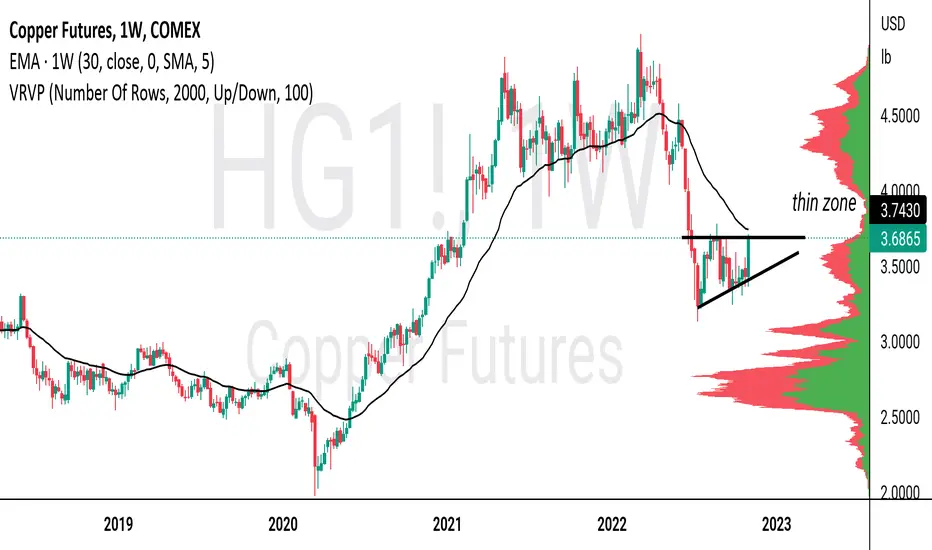
Copper down 5 days in a row; 3.5545 is keyThe industrial metal topped on March 7th at 5.0395. However, for the next 3 months, HG sold off aggressively and made a July 15th low at 3.1315! Fears of increased inflation, increased interest rates, and increased Covid cases in China led to a fear of lack of future demand. Copper traded between 3.2430 and 3.7830 from mid-July and November 10th, when it gapped higher the day after a lower-than-expected US CPI reading. However, Copper was stopped just short of the 200-Day Moving Average near 3.9600 on November 14th, and it hasn’t looked back since. After a 5-day selloff, is copper ready to bounce?
News of additional lockdowns and the “take-back” of a loosening of restrictions caused Copper to continue lower. Copper traded to horizontal support on Monday near 3.5545. If this price breaks, copper may easily fall to 3.3625. The next horizontal support levels are at the lows from September 28th at 3.2430, then the lows from July 15th at 3.1315.
However, don’t be surprised if there is some profit-taking ahead of the long US holiday at the end of the week. Sellers will be looking to add to shorts if price does bounce. The first resistance level is at the August 26th highs of 3.893, then a confluence of resistance at:
1. the highs of November 14th
2. the 200 Day Moving Average,
3. the 61.8% Fibonacci retracement level from the highs of June 3rd to the lows of July15th.
This resistance zone is between 3.9600 and 4.0250.
However, 3.5545 seems to be the “make or break” level for copper. If it breaks, copper could be on its way to the next support at 3.3625. But if it holds, it could bounce to the 4.000 area!

Copper (COPPER/INR) Commodity Analysis 18/07/2021 Technical Analysis:
As you can see, there exist a hidden Bullish Divergence with MACD which is the sign of bullish trend continuation as Copper has started its bullish wave since March 2020. It is moving in an ascending channel. We draw Fibonacci retracement from the low to the top of last impulsive wave which are defined as the Fib levels on chart. The commodity fell to 78% Fibonacci Retracement and it is consolidating and accumulating on Fibonacci Golden Zone currently. we believe this commodity is getting ready to shoot to the higher targets which are defined by Fibonacci Projection tool of the past wave.

Metals to Break its All Time High AgainMetals to Break its All Time High. I have discussed about Gold before and in this tutorial we will study into Copper.
From last week Fed chairman statement, he said “it is premature to be talking about pausing our rate hike. We have a ways to go."
The continuous inflation is almost a certainty into next year, and what asset or instrument works well with inflation?
Content:
Why interest in copper again
• Fundamental
• Technical
5 Major Copper Uses:
• Building Construction
• Electronic Products
• Transportation
• Industrial Machinery & Equipment
• Medical
Copper Consumption Worldwide:
1. China 54%
2. Europe 15%
3. Other Asia 14%
4. America 11%
5. Other 6%
Source: Statista 2021
Minimum fluctuation
0.0005 per pound = $12.50
0.001 = $25
0.01 = $250
0.1 = $2,500
Disclaimer:
• What presented here is not a recommendation, please consult your licensed broker.
• Our mission is to create lateral thinking skills for every investor and trader, knowing when to take a calculated risk with market uncertainty and a bolder risk when opportunity arises.
CME Real-time Market Data help identify trading set-ups in real-time and express my market views. If you have futures in your trading portfolio, you can check out on CME Group data plans available that suit your trading needs www.tradingview.com

#COPPER Weekly Major Support & Resistance Levels.Providing Weekly Support and Resistance levels for next coming week based on Central Pivot Range and its major support & resistance levels of week, where price can take support and face resistance. Three black lines indicating weekly Central Pivot Range. Previous week high & low also performs as a major support and resistance levels. Can take long & short positions according to how price perfoms at particular given support & resistance levels.

COPPERCopper - If break Triangle with stong volume, Targets as highlighted in Orange and Dinapoli FIB level(Blue)

Copper - Is Copper About to Become the New Gold?Copper Linear Mode Hourly/Monthly
With the recent breakdown in gold it seems unlikely to expect appreciation in copper although this chart suggests otherwise.
Is copper about to become the new gold ?
The Monthly chart shows copper has completed a wave 4 pattern at the lower channel as shown.
On the hourly chart prices are currently printing a bullish pattern that will unfold in a larger wave 5 up.
Although there is more than one possibility to label the current structure I believe a breakout of the diagonal will confirm this is in the early stage of a wave three pattern upward. This should be a powerful move up so put it on your radar.
MONTHLY

Bullish flag breakout A bull flag is a bullish chart pattern formed by two rallies separated by a brief consolidating retracement period.
The flagpole forms on an almost vertical price spike as sellers get blindsided from the buyers, then a pullback that has parallel upper and lower trendlines, which form the flag.

Bullish flagA bull flag is a bullish chart pattern formed by two rallies separated by a brief consolidating retracement period.
The flagpole forms on an almost vertical price spike as sellers get blindsided from the buyers, then a pullback that has parallel upper and lower trendlines, which form the flag.

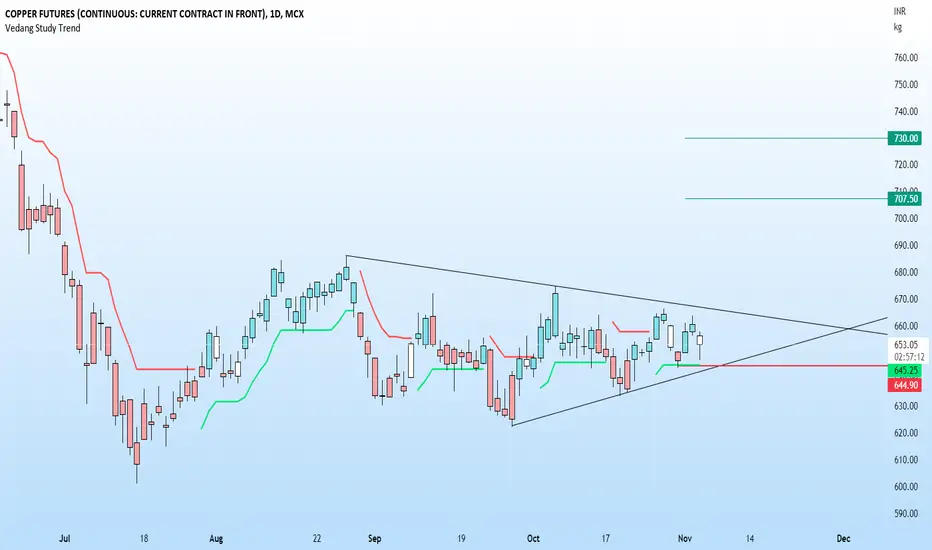
CopperCopper CMP 653.5
Looking at the chart,
As long as we hold 645 levels
we can see price moving towards green lines
which is 707.5/730 levels
Vedang :)
Chart is for study purpose only
BUY Copper Futures with high probabilityHello ladies and gentlemen, according to my graphical analysis of The copper Futures, there is a high probability of going to 4,13$ in the next few weeks.

Copper Futures ( HG1!), H4 Potential for Bearish MomentumType: Bearish Momentum
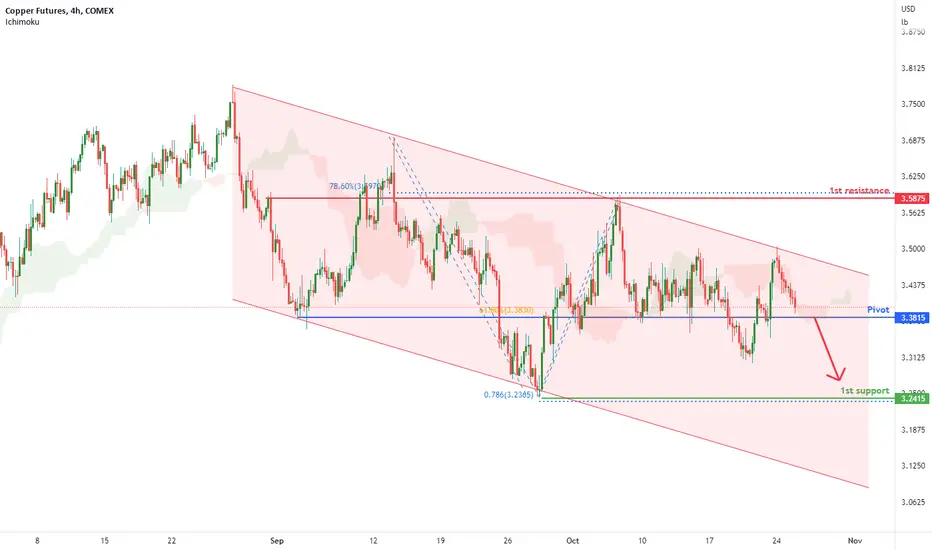
Resistance: 3.5875
Pivot: 3.3815
Support: 3.2415
Preferred Case: The H4 price is in a downward channel and crossing below ichimoku cloud . The price may drop form the pivot at 3.3815, where the 61.8% fibonacci retracement is to the 1st support at 3.2415 where the swing low and 78.6% fibonacci projection sits
Alternative scenario: If there is a price reversal, price will move to 3.5875, where the swing highs and 78.6% fibonacci retracement are.
Fundamentals: There are no major news.

DR. Copper Trading The Bearish SequenceCopper on the weekly time frame appears to be carving out a five wave decline as the wave 4 high at 3.7930 holds a minimum downside objective of wave five equaling wave one provides a downside objective at 2.8435. The wave 4 on the daily time frame is creating a descending triangle pattern a break of 3.1380 warrant short exposure to target the wave 5 objective.

Copper Futures ( HG1!), H4 Potential for Bearish MomentumType: Bearish Momentum
Resistance: 3.5875
Pivot: 3.3815
Support: 3.2415
Preferred Case: The H4 price is in a downward channel and crossing below ichimoku cloud . The price may drop form the pivot at 3.3815, where the 61.8% fibonacci retracement is to the 1st support at 3.2415 where the swing low and 78.6% fibonacci projection sits
Alternative scenario: If there is a price reversal, price will move to 3.5875, where the swing highs and 78.6% fibonacci retracement are.
Fundamentals: There are no major news.

ATTENTION ! Free insightATTENTION! We have a solid opportunity to buy copper for stock, accumulate it, and make millions.

Copper FragilityCopper making lower highs after breaking down from 12 month big base. Next leg lower looks imminent.

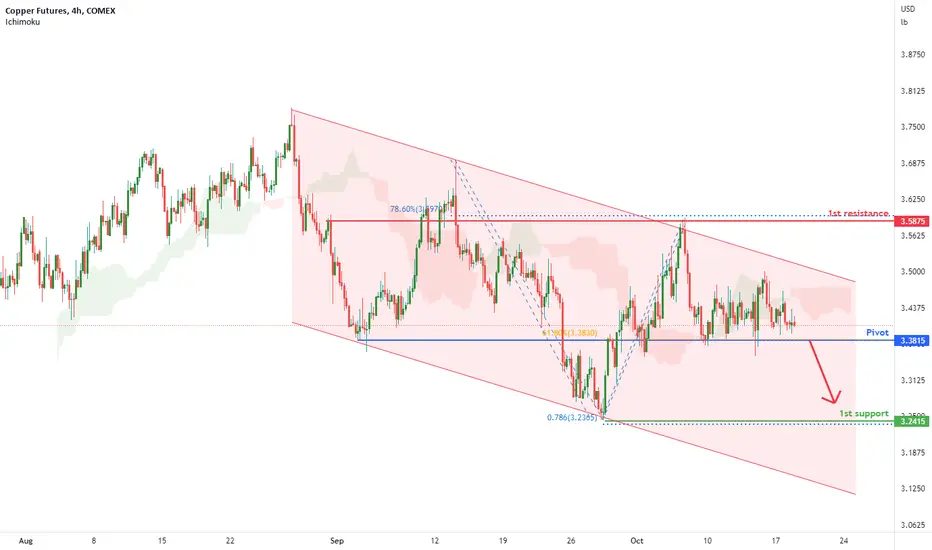
Copper Futures (HG1!), H4 Potential for Bearish DropType: Bearish Momentum
Resistance: 3.5875
Pivot: 3.3815
Support: 3.2415
Preferred Case: The H4 price is in a downward trend and crossing below ichimoku cloud . The price is consolidating now, if the price can break the consolidating area, the price may drop form the pivot at 3.3815, where the 61.8% fibonacci retracement is to the 1st support at 3.2415 where the swing low and 78.6% fibonacci projection sits
Alternative scenario: If there is a price reversal, price will move to 3.5875, where the swing highs and 78.6% fibonacci retracement are.
Fundamentals: There are no major news.

Copper Futures (HG1!), H4 Potential for Bearish DropType: Bearish Momentum
Resistance: 3.5875
Pivot: 3.3815
Support: 3.2415
Preferred Case: The H4 price is in a downward trend and crossing below ichimoku cloud. The price is consolidating now, if the price can break the consolidating area, the price may drop form the pivot at 3.3815, where the 61.8% fibonacci retracement is to the 1st support at 3.2415 where the swing low and 78.6% fibonacci projection sits
Alternative scenario: If there is a price reversal, price will move to 3.5875, where the swing highs and 78.6% fibonacci retracement are.
Fundamentals: There are no major news.
Copper... My view until 2023This projection is based on an Elliott Wave count and relies on commodities regaining a bid, from their recently mild toxicity.
DYODD
S.

BEAR FLAG In the context of technical analysis, a flag is a price pattern that, in a shorter time frame, moves counter to the prevailing price trend observed in a longer time frame on a price chart. It is named because of the way it reminds the viewer of a flag on a flagpole.
The flag pattern is used to identify the possible continuation of a previous trend from a point at which price has drifted against that same trend. Should the trend resume, the price increase could be rapid, making the timing of a trade advantageous by noticing the flag pattern.

Copper Inverse Head and Shoulders December Copper has been trading in a range since the big breakdown at the end of June, and a lot of the downward action has come from negative Covid news out of China along with the dollar pushing higher. As we look at the dollar potentially having a blowoff top and the inverse head and shoulders pattern, there could be a push higher toward the 50-day moving average, also aligning with trendline resistance. Continued bearish news out of China or the dollar continuing higher would hurt copper and could drive the market to the bottom end of its current range.
