LUN1! trade ideas


Nickel Trading RangesNickel has good resistance at 1,415 per Fibonacci. The buying levels seem around 1,350 to 1,360 levels. Wait for the low and buy on dip is recommended.


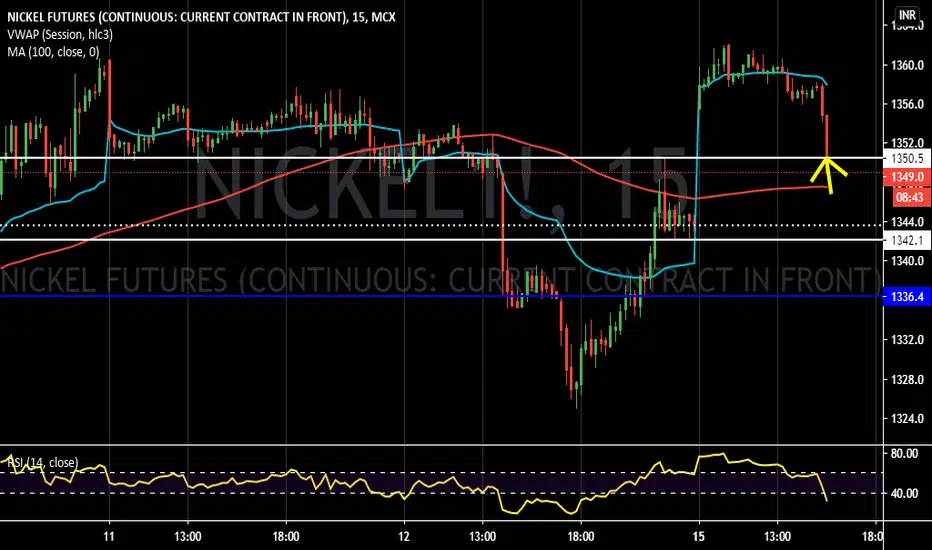
Nickel ShortNickel has shown resistance around 1340 levels.
Twice broke 200 EMA on 30 min timeframe.
Any pull back with rejection around 200 EMA would be a good chance to enter short position. on higher timeframe number of supports are still intact.
This is just for an educational purpose.

Nickel trend projection #Nickel trend projection whether ascending higher high and higher lows formed while travelling in a channel panda which support is 1326..27 on the way down and here we should buy there on 1328 with sl 1325 tgt 1355... 1380..
Mcx Nickel trend analysis It just found out as nickel trend projection wheher like it is ascending higher high lows while travelling in a channel panda which support is 1326..27 on the way down and here we should buy there on 1328 with sl 1325 tgt 1355... 1380..


NICKEL (31 Mar 21) May Move Upside Till 1391/1400MCX Nickel (Mar) will move upside till 1391/1400 above 1383.60 with SL 1377
MCX:NICKEL1!

Trend AnalysisIt seems sideways.
Sell below 1,347
Targets 1,346/1,344/1,341
Stop Loss 1,356
*Disclaimer : I just share my view. Please trade with your own and comfortable ideas.


NICKEL (31 Mar 21) May Move Upside Till 1437/1442MCX Nickel(31Mar 21) May move upside till 1437/1442, with Immediate support 1424 but safe Sl will be below 1421.
MCX:NICKEL1!


NICKEL (26 FEB) MAY MOVE UPSIDE NICKEL ( 26 FEB) is moving in bullish trend from last few days. In an hourly chart RSI(14) is moving above the 60 which suggests a bullish strength we can initiate long position near 1349-1345 and it make take support of the 1341, upside it may bounce back till 1369. MCX:NICKEL1!
Disclaimer: it's my view just for study purpose.

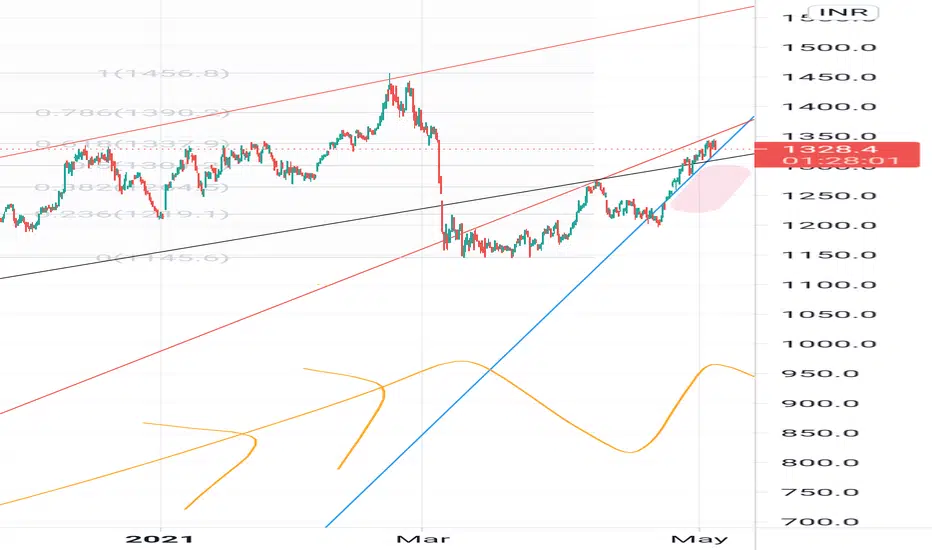
MCX Nickel Parabolic Curve Pattern & TipsThis is MCX Nickel weekly chart. Price projection is based on Parabolic Curve & Fib Retracement.
As mentioned in the chart, At the end-point of Base 3, indicated by the "X" symbol, the nickel could double in the shortest period of time. Targets: 1426 - 1632 - 1778 - 1854 - 1962 ( 2.618 - Based on Fib Retracement ).
If nickel breaks the curve line, it can collapse up to "X" or base 3 deep. Hence, we can see the following targets from the selling point: 1130 - 1050 - 960 - 850 and below .
Remember, trade with the direction of the breakout. And stop-loss above/below breakout level.


