#SIlver #XAGUSD Targeting A Weekly Equality ObjectiveIn this update we review the recent price action in the Silver futures contract and identify the next high probability trading opportunity and price objectives to target
•Past performance not indicative of future results
SIU1! trade ideas

SILVER FUTURES Stock Chart Fibonacci Analysis 070923 Trading Idea
1) Find a FIBO slingshot
2) Check FIBO 61.80% level
3) Entry Point > 23/61.80%
Chart time frame : B
A) 15 min(1W-3M)
B) 1 hr(3M-6M)
C) 4 hr(6M-1year)
D) 1 day(1-3years)
Stock progress : A
A) Keep rising over 61.80% resistance
B) 61.80% resistance
C) Hit the bottom
D) Hit the top
Stocks rise as they rise from support and fall from resistance. Our goal is to find a low support point and enter. It can be referred to as buying at the pullback point. The pullback point can be found with a Fibonacci extension of 61.80%. This is a step to find entry level. 1) Find a triangle (Fibonacci Speed Fan Line) that connects the high (resistance) and low (support) points of the stock in progress, where it is continuously expressed as a Slingshot, 2) and create a Fibonacci extension level for the first rising wave from the start point of slingshot pattern.
When the current price goes over 61.80% level , that can be a good entry point, especially if the SMA 100 and 200 curves are gathered together at 61.80%, it is a very good entry point.
As a great help, tradingview provide these Fibonacci speed fan lines and extension levels with ease. So if you use the Fibonacci fan line, the extension level, and the SMA 100/200 curve well, you can find an entry point for the stock market. At least you have to enter at this low point to avoid trading failure, and if you are skilled at entering this low point, with fibonacci6180 technique, your reading skill to chart will be greatly improved.
If you want to do day trading, please set the time frame to 5 minutes or 15 minutes, and you will see many of the low point of rising stocks.
If want to prefer long term range trading, you can set the time frame to 1 hr or 1 day.

DeGRAM | SILVER in upward channelSilver is in a bullish trend. It had higher highs and higher closes.
Price is coiling up before expansion by creating a consolidation zone following bullish momentum.
We expect pullback to support and fibo level and look for buying opportunities.
-------------------
Share your opinion in the comments and support the idea with like. Thanks for your support!

Coffee Gold Silver6.28.23 This video is an excellent example of why I shouldn't do videos what I'm actually trying to make a trade. I am sorry for my behavior... but all I can say Is {Tough bananas}... you get what you get. I would exit the long position and coffee. I am trying to decide if I'm going to buy gold or silver this morning.

silverSilver not trading at crucial support zone . highly chance to trend change in silver. if not close below 66k we again seen 70/72/75k
Disclaimer: all views are education purpose only.

DeGRAM | Silver a trend continuation opportunitySilver dropped from the resistance, and it created a descending channel.
Price action created a resistance and a fibo level as confluence zone.
If the market fails to break through the resistance level , we can sell from the confluence level.
We anticipate a trend continuation trade.
-------------------
Share your opinion in the comments and support the idea with like. Thanks for your support!

sell silevr blw 68500 tg t67700 looks sell silevr blw 68500 tg t67700 looks sell on sl 68911 looks some presure due to usd index

A quick follow-up on gold6.21.23 Gold did break the support line... and It reversed at a measured move. how do we handle this? We have to think it through and the answer has something to do with our personalities and whether we are comfortable Shorting, Going Long, and whether we are able to stop and reverse in our trading.

Silvermic sell trade Sell silver around 71900 putting SL above 72100 and take targets using 1:2,1:3,1:4 and 1:5 RRR

SILVER: Price at perfect support!Silver is in bullish move since past few months.
After a good trendline and resistance breakout it has come to test it, and formed a good bullish candlestick pattern to support its trend.
You can put Silver in your watchlist.

DeGRAM | Silver deceleration at resistanceSilver is decelerating while approaching the resistance level.
The market shows massive divergence on the 4H timeframe and pinbars.
We anticipate a short-term pullback and even further movement down if price breaks and closes below the ascending channel.
-------------------
Share your opinion in the comments and support the idea with like. Thanks for your support!

Silver Price Analysis: Exploring Resistance, CP, Volume, Events Upon analyzing the chart, it is evident that silver has been trading within a parallel channel for almost a year, indicating a well-defined price range. In the previous trading session, the price of silver reached the resistance line of this channel. For short-term traders, a critical resistance level to watch is 74060. If this level is not surpassed convincingly, it could lead to a potential downturn towards the control price (CP) line. It is worth noting that silver has yet to test the CP line and the 100-day moving average (MA) successfully.
Taking into consideration the parallel channel pattern, it suggests that silver prices may experience a decline towards levels around 73000 , 71800 , and 71360 .
Furthermore, volume plays a significant role in the current scenario. Short-term investors should be cautious and await a successful breakout of the channel for a potential upside move towards price levels of 74900 , 75560 , and even exceeding 76800 . Monitoring the volume and price action closely will provide further insights into the market direction and potential trading opportunities.
As a market participant, it is important to closely monitor the following market-moving events, as they have the potential to impact the prices of gold, silver, crude oil, and natural gas:
Monday, Jun 12, 2023
23:30 Federal Budget Balance (May) and Note Auctions: These events have a medium impact and can provide insights into the economic health of the country, potentially influencing investor sentiment and market movements.
Tuesday, Jun 13, 2023
11:30 Employment & Unemployment, Avg Earning Index, Claimant Count Change: These medium-impact events provide crucial data on the labor market, which can have a significant effect on commodity prices.
18:00 CPI and Core CPI: These high-impact events reveal the inflation rate, which is closely watched by traders as it can impact the value of commodities.
Wednesday, Jun 14, 2023
02:00 API Weekly Crude Oil Stock: This medium-impact event discloses the inventory levels of crude oil, which can influence crude oil prices.
18:00 PPI and Core PPI: These medium-impact events measure changes in producer prices and can affect commodity prices.
20:00 Crude Oil Inventories: This high-impact event reports the weekly changes in crude oil stocks, which can impact the price of crude oil.
23:30 Fed Interest Rate Decision & Projection, and FOMC Economic Projections & Statement: These high-impact events provide insights into the monetary policy decisions of the Federal Reserve, which can have a broad impact on commodity markets.
Thursday, Jun 15, 2023
00:00 FOMC Press Conference: This medium-impact event involves a press conference following the Federal Reserve's interest rate decision, providing further context and potential market-moving statements.
18:00 Import Prices MoM & YoY: This low-impact event reports changes in import prices, which can indirectly affect commodity prices.
20:00 EIA Natural Gas Stocks Change: This low-impact event reveals the weekly changes in natural gas inventories, potentially impacting natural gas prices.
Friday, Jun 16, 2023
01:30 Net Long-term TIC Flows: This low-impact event discloses the flows of international capital, which can have an indirect impact on commodity markets.
17:15 Fed Waller Speech: This low-impact event involves a speech by a Federal Reserve official, which may provide insights into monetary policy and influence market sentiment.
19:30 Michigan Consumer Sentiment: This medium-impact event measures consumer confidence, which can affect demand for commodities.
Monitoring these events will help traders and investors stay informed about potential catalysts that can impact the prices of gold, silver, crude oil, and natural gas.

Silver may shine above mid channel ResistanceSilver futures tried to jump unsuccessfully above the Mid channel line resistance but has been unsuccessful so far. Closing above 74324 will unleash a new bull run in Silver which might have resistances at 76341 and 78000+. The two resistances can also be considered next targets in case of closing over 74324. In case the mid channel line proves to be potent resistance the supports for Silver future are at 72850 and 72490 (Major Support). If 72490 is broken by any chance next supports are at 70174 and 68017.

Silver backing offTraders who think silver will retreat a bit from recent overbought levels could short the July contract here.

Big Money About to be made on SILVER I had an idea on this last night, but following an IOFED into a higher timeframe FVG, we see on the 1hr chart that SILVER has a HIPPO (hidden interbank price point objective) lower.
There's therefore confluence to get in now on a silver short.
I am not saying silver won't drop and then pop, I'm looking for one single impulsive move down.

Silver has trailers to purge and clear outSilver looking poised for a PM session short here as too many traders are profitable on the longside.
Additionally, DXY looks like it wants to move up in the PM session now, which is confluence.
I think silver is going to take the trailers out back soon.

#Silver #XAGUSD The Set Up For A $27 TestIN this update we review the recent price action in the Silver futures contract and identify the next high probability trading opportunity and price objectives to target

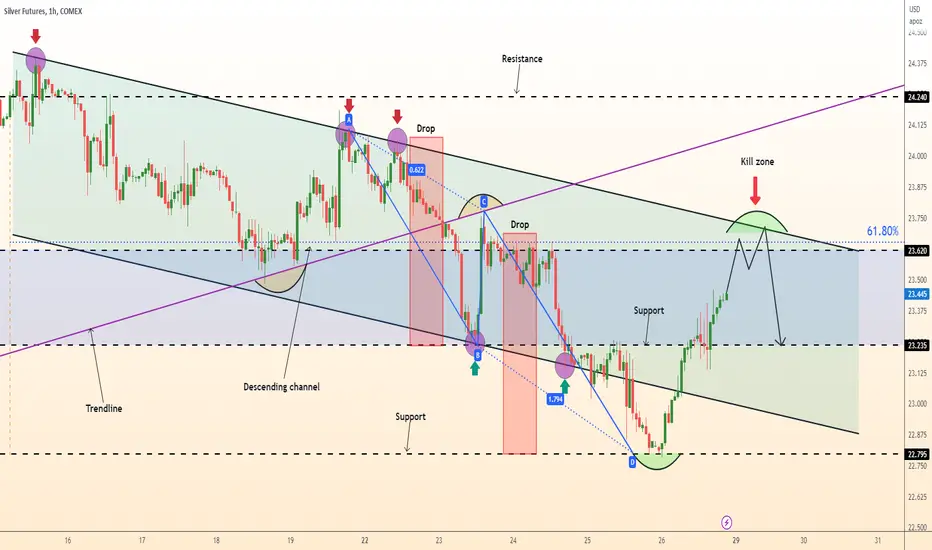
DeGRAM | Silver short from kill zoneSilver is approaching the resistance level and the fibo level.
The market is in a bearish trend; it's making lower lows.
We anticipate a short opportunity from the kill zone.
-------------------
Share your opinion in the comments and support the idea with like. Thanks for your support!
Silver to flash crash to 11$s Silver is always difficult to chart - so this time I've used the fib extension 1.618 to get my target.
We've had several lower highs and now a lower low, so the sentiment is ready for a dramatic collapse to retest the low at 11 NYSE:S
I'll be furiously stacking the physical below the 13$ mark.

The short position of silver does not change, and the rebound co
Life promises you nothing, least of all success. It will only give you struggle, pain. So give yourself a dream and move in that direction. Without dreams, life is meaningless.
Silver also launched a short-term counter-drawing today, but the overall decline is not over, so continue to consider high altitudes in the face of pressure at night. The first suppression in the morning has failed, and you can wait for the second pressure zone to find an opportunity to act in the evening. Silver operation suggestion 23.83 sell stop loss 23.99 target 23.50~23.30
If the silver daily line falls below the 23.50 first-line support, it will still be in a downward trend in the short term. At present, the golden ratio of 38.2% has fallen below, and it will continue to fall to the 50% line after it becomes counterpressure. The intraday pressure is 23.83~23.99, and the support is at 23.5~23.3.
Join me and I will guide you to a profitable trade 💵!

SILVER FUTURES Stock Chart Fibonacci Analysis 051823 Trading Idea
1) Find a FIBO slingshot
2) Check FIBO 61.80% level
3) Entry Point > 23.8/61.80%

Silver is not afraid of rebounding and continues to fall
In the journey of life, you always have a part of the way that you need to walk and carry by yourself. Don't feel afraid or lonely. This is just the price of your growth.
Although the rebound of silver within the day was close to the previous rebound high, the bears did not give too many opportunities to rise. At present, the bearish trend is expected to form again. It is expected that silver will usher in another decline in the evening. For silver operation, it is recommended to sell at 24.13, risk control at 24.29, and the target is 23.70~23.35.
The silver daily line continues to close in the negative, but it may not go down again until it fluctuates around the short-term support around 23.70. The intraday pressure is 24.13~24.25, and the support is at 23.70~23.35.
Join me and I will guide you to a profitable trade 💵!

Silver: Let the show begin…! 🎪Ladies and Gentlemen, step right up and let the show begin! Please welcome silver, our brilliant artistic performer, in the arena that is our chart… See next: a somersault into the orange zone between $24.45 and $25.05 to finish wave iv in orange, followed by a brave downwards leap to complete wave v in orange as well as wave (a) in blue. Watch with bated breath as silver then spirals upwards again, stopped only by the mark at $25.41, where it should rebound and glide further downwards. There is a 30% chance, though, that silver could gain too much upwards momentum and thus soar above the mark at $25.41. In that case, we would expect it to reach a new high in the form of wave alt.x in magenta first before turning downwards again.
