HNTUSD: Helium Elliott Wave History and Outlook2024-02-12 Helium Elliott Wave History
Helium has had a nice run recently appreciating its price about six-fold into the 8 USD range.
It appears that only the third wave has completed. A similar run may be expected with a continuation of the bitcoin driving force in the background.
HNTUSD trade ideas

My target on HNTUSDMy buddy Paul S made sure I was in this project. Chart looks nice! :-)
buy low, sell high

Helium: Spontaneous Chart Art.What can I say?
Just opened this chart… nothing doctored.
Did helium play a game with the tail?

Is HNT Ready To Cross $10?HNT's Impressive Rebound: Helium price surges 46% this week, showcasing a remarkable recovery.
Morning Star at $2: A key reversal pattern that triggered the upward trajectory.
Current Trading Price: HNT trades at $7.55, with a 2.07% increase in the day.
Bullish Market Sentiments: Fueled by the positive market reaction to the Bitcoin Spot ETF approval.
Recovery from a 40% Drop: Helium bounces back strongly from a significant low.
Challenge to 38.20% Fibonacci Level: Aiming to break past $7.95, signaling further bullish potential.
MACD Indicator's Bullish Crossover: Suggests continued upward momentum.
Breakout Above $8: A potential move, breaking the current resistance.
Targeting the $10 Mark: Eyes set on achieving a significant psychological level.
Increased Trading Volume: Supporting the bullish movement in Helium’s price.
Potential for a New High in 2024: Prospects look favorable for Helium.
Technical Analysis Outlook: Shows a strong bullish trend in motion, hinting at sustained growth.
Helium is playing out a bullish pennantHelium is playing out a bullish pennant. Will provide more details shortly.

hntusdthntusdt can :
1- pullback to supply and after that move up to upper ressistance
2- if breakout ressistance, can move to upper resistance

HNT Ballooning to new Heights - Potential Price TargetsHelium Network is an extremely promising venture, Not only due to its revolutionary vision but also its solid team and feverish community of supporters.
Solana Phone is likely to bring the price to new highs, very soon.
Here are my current price points for HNT
Support zone: 5.28 - 6.883
Resistance Level: 7.82
Target 1: 11.11
Resistance Level: 12.02
Target 2: 13.79
Helium (HNT) is a decentralized blockchain-powered network for Internet of Things (IoT) devices.
Launched in July 2019, the Helium mainnet allows low-powered wireless devices to communicate with each other and send data across its network of nodes.
Nodes come in the form of so-called Hotspots, which are a combination of a wireless gateway and a blockchain mining device. Users who operate nodes thus mine and earn rewards in Helium’s native cryptocurrency token, HNT.
Helium’s goal is to prepare IoT communication for the future, identifying inadequacies in current infrastructure from its birth in 2013.

HNT Price Teases Bullish Reversal with 40% Upside Current Trend: HNT price exhibits a bullish trend, currently undergoing a retest at the $6.62 level.
Technical Formation: A morning star pattern at the 61.80% Fibonacci retracement level ($6.62) indicates a potential bullish reversal for Helium.
Bullish Momentum: Strong reversal signals suggest that HNT could refuel its bull run, eyeing a breakout above $10.
Market Context: HNT's resilience amidst a bearish trend in altcoins highlights strong buyer support.
Recent Performance: After failing to breach $10, HNT price experienced a sharp decline but showed lower volume during the pullback, hinting at a temporary setback.
Current Position: HNT trades at $7.275, gaining 9.65% intraday, and forms a bullish engulfing candle, indicating a resurgence of buying interest.
Fibonacci Levels: Trend-based Fibonacci analysis suggests the HNT price might target $10.45, a potential 40% increase.
Technical Indicators:
RSI: Indicates a positive shift, moving towards the overbought zone without divergence, signaling strong upward momentum.
MACD: Prepares for a bullish crossover, reducing bearish histogram intensity, hinting at an upcoming trend reversal.
Potential Rally: If HNT sustains its current momentum, it could initiate a 43% rally to challenge the significant resistance level at $10.43.
Downside Risks: Failure to maintain bullish momentum might lead to retesting the support at $6.62

Helium to $20Helium to $20?
Helium currently trading at $7.6
Stoch Rsi = bullish
Rsi = Neutral > bullish
Macd = Neutral > bullish

Short term trade for HNT if you are lookin to get in.look for these support lines as long as we hold the trend line we are good.. consolidate and ready again for the next leg up.

Remarkable Recovery in HNT Eyes $10 Breakout!Impressive Recovery Trend: Helium (HNT), ranking 57th in market cap, witnesses a substantial recovery, rising 112% from a low of $4 to a current price of $8.43.
Breakout from Key Resistance: The HNT price has successfully breached the critical $3.8 resistance, indicating the end of a long accumulation phase and signaling strong buying interest.
Backed by High Volume and Momentum: The post-breakout rally of Helium is supported by increased trading volume and momentum, suggesting a bullish sentiment in HNT price predictions.
Influence of Recent Developments: Helium's recovery is boosted by its new $20/month nationwide phone plan, offering an unrestricted and cost-effective mobile experience, contributing to the coin's momentum.
Piercing through Crucial Barriers: HNT has successfully crossed significant resistance levels at $3.8, $5.7, and $8.2, laying a foundation for sustainable growth.
4-Hour Chart Analysis: The HNT price shows exponential growth with consecutive bullish candles, suggesting a potential reach to the $10 mark based on recent pullbacks and Fibonacci levels.
Technical Indicator - RSI: The Relative Strength Index (RSI) above 80% indicates aggressive buying among traders, reinforcing the bullish trend.
Potential to Surpass $10 Milestone: The weekly chart reveals a rounding bottom pattern in HNT's recovery, a typical indicator of market bottom and trend reversal. The recent breach of $8.2 resistance could lead to a 27.5% rally, aiming for the next major resistance at $10.6.
Possible Short-term Pullback: Despite the bullish trend, the presence of long-tail candles near the $8.2 support zone suggests potential profit-booking by short-term traders, possibly triggering a minor pullback.

HNT starting to rally!I'm not sure HNT can surpass previous All time high this coming Bull market. But probably selling 60% of my bags around $24 range

HNT CHART UPDATEThis could be something good.
Some structure needs to be built.
It won't be only done with my pocket.....
Low volume(like the entire market rn)... BUT that means it can pump easily!!
NOT FINANCIAL ADVICE!!!

HNT HAS SOME MOJOI like what I see left.
Bought some already and plan on buying more.
If this support holds maybe 20-40% gains!!
NOT FINANCIAL ADVICE!!!!

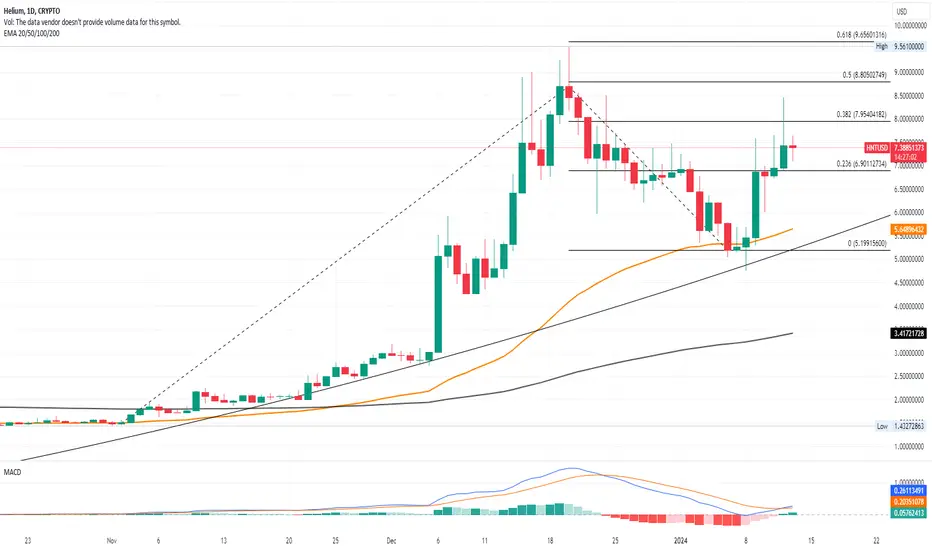
HNTUSD 1W MA100 only barrier before $12.500Helium (HNTUSD) is on an enormous rise that just reached the 0.382 Fibonacci level of the Bear Cycle correction, headed towards the Supply/ Demand Equilibrium Zone. That's also trading towards that Zone is the 1W MA100 (red trend-line), the last long-term Resistance of the market. We expect a rejection there and a pull-back to the 1D MA50 (blue trend-line) to attract new buyers. Once HNT closes a 1W candle above the 1W MA100, we will target 12.500, which is both the 0.618 Fibonacci level and the June 10 2022 High.
-------------------------------------------------------------------------------
** Please LIKE 👍, FOLLOW ✅, SHARE 🙌 and COMMENT ✍ if you enjoy this idea! Also share your ideas and charts in the comments section below! This is best way to keep it relevant, support us, keep the content here free and allow the idea to reach as many people as possible. **
-------------------------------------------------------------------------------
💸💸💸💸💸💸
👇 👇 👇 👇 👇 👇

Hnt roadmap I have marked out some key areas on chart for hnt. I dont know if it will return to the highs of last bull some tokenamics may have changed in the shift to Solana chain. I would be interested in anyone's fundamental opinions.

HNTUSD Major bullish break out targeting 1.8000.Helium crossed and closed over the 1D MA50 yesterday for the first time in 56 days. This is an early buy signal as the 1D technicals are still neutral (RSI = 50.663, MACD = -0.016, ADX = 29.754) but the RSI is already rising on an HL trendline.
We are buying this breakout early as with the March 24th breakout and target the 1D MA200, a little over the 0.382 Fibonacci level (TP = 1.8000).
## If you like our free content follow our profile to get more daily ideas. ##
## Comments and likes are greatly appreciated. ##

HNTUSD Can skyrocket to 16.000Basic fractal projection for HNTUSD/ Helium as the RSI action today resembles he price action of late 2020.
Both on a V-shaped/ Inverted Head and Shoulders pattern, in 2021 that targeted exactly Fibonacci 3.0.
Target a little under it at 16.000. Assume as confirmation the breakout over the 1day MA200.
Follow us, like the idea and leave a comment below!!

No diamond, but we have a double bottomno diamond played out as I expected, but we had a little more downward pressure to a double bottom, the test is coming at 1.70 zone, break that 2.60 next major area iMO

HNT Bear wedge concluding evidenced by bull diamondbear wedge seems to be coming to an end with the inflection point being a bull diamond that has been a battle over the past few days, it seems we are at the end and caught between two downward sloping trend lines ( a channel of sorts) get ready for a breakout by the next weekly close (New Years!)

HNT’s Elliott TargetsWe have Wave 5 at a textbook strong resistance zone. RSI and Momentum are flipping to the downside which indicates a correction. I see Wave A testing support at $10.39. If $10.39 breaks, the next zone will be around the $9.70 target. I do see the first support test to hold though. Ultimately, I see HNT coming to $9.70 to complete the ABC correction.
Stop loss - $11.80
Min TP- $10.39
This chart based off of The Elliot Wave Theory, Fibonacci, EMA’s, MacD, RSI, Momentum, and resistance/support zones combined with patterns.

hnt/usd helium cup and handle august 2021, a nice tutorial where you can see a cup and handle pattern. can be used for information

HNT - MMSM - 14.06.22HTF Bias is bearish here:
Option 1: bearish diagonal retest
Option 2: Market structure break pattern around current level
