HOOKUSDT CHART ANALYSİS- EDUCATİONAL POSTBest Books on Algorithmic Trading
By now we all know how effective and profitable algorithmic trading can be for traders and investors. In stock markets across the world, algorithmic trading alone accounts for approximately 70-80% of trading volume. You read that correctly.
Yet the vast majority of people trading crypto are doing it manually, resulting in missed or poorly timed trades. Even worse, manually trading is based on feeling and gut instinct rather than data and analysis, resulting in costly mistakes and missed opportunities.
However, despite its many benefits, algorithmic trading might seem a bit complex at first. Thankfully, there’s no shortage of excellent books to get you started if you’re a beginner interested in learning about automated trading strategies. And for the more advanced algo traders among us, there is always something new to learn.
With this in mind, we’ve put together a handy list of the best books on algorithmic trading, covering users of all experience levels, whether you’re a beginner in need of a basic introduction or a seasoned veteran looking to add a few additional advanced tools and techniques to your trading arsenal.
HOOKUSDT trade ideas

HOOKUSDT UPDATEHOOKUSDT is a cryptocurrency trading at $0.2285. Its target price is $0.4000, indicating a potential 120%+ gain. The pattern is a Bullish Falling Wedge, a reversal pattern signaling a trend change. This pattern suggests the downward trend may be ending. A breakout from the wedge could lead to a strong upward move. The Bullish Falling Wedge is a positive signal, indicating a potential price surge. Investors are optimistic about HOOKUSDT's future performance.

#HOOK/USDT #HOOK
The price is moving in a descending channel on the 1-hour frame and is adhering to it well and is heading to break it strongly upwards
We have a bounce from the lower limit of the descending channel, this support is at a price of 0.2586
We have a downtrend on the RSI indicator that is about to be broken, which supports the rise
We have a trend to stabilize above the moving average 100
Entry price 0.2757
First target 0.2903
Second target 0.3046
Third target 0.3182

#HOOKUSDT It is possible that the specified path will be followed. The transaction is risky and it is necessary to observe the loss limit. You can enter the bridge to manage capital.

HOOKHOOK/USDT Technical Analysis
The chart shows an important support zone (box) between $0.388 - $0.358. This level is critical for maintaining the bullish structure. If the price holds above this zone, there is potential for a rebound toward the $0.45 resistance, aligning with key moving averages (SMA 55 and SMA 89).
The recent breakdown below the trendline indicates short-term bearish pressure, but the oversold RSI at 36.21 suggests a possible recovery.
Key Scenarios:
Bullish:
If the price holds the support zone and RSI moves upward, a test of $0.45 is likely.
A breakout above $0.45 could extend the rally toward $0.48 - $0.50.
Bearish:
A breakdown below $0.358 may lead to further downside, targeting $0.32 or lower.
Recommendation:
Watch the volume closely to confirm a move, and consider placing a stop-loss below the support box to manage risk effectively.

HOOKUSDT 6DHOOK ~ 6D
#HOOK This is the last support block for this coin. If you still have Conviction on this coin,. This support block would be a very good buying place for now,. Buy in stages with a minimum target of 20%+


TradeCityPro | HOOKUSDT Potential Start of a Sharp Move👋 Welcome to the TradeCityPro channel!
Let’s analyze the market on this quiet Saturday with low volume. We'll focus on identifying and aligning our triggers for HOOK.
🌍 Market Overview
Before starting, as always, we take a quick look at Bitcoin. Today, it hasn’t made any significant moves and is mostly range-bound. However, volume seems to be entering, suggesting that we might see another upward movement either tomorrow or in the coming week.
During such upward movements, Bitcoin dominance may decline, providing an opportunity for altcoins to shine. This is when altcoins can generate substantial profits, so make sure to stay close to the charts during these times.
🕒 Weekly Time Frame
In the weekly timeframe, HOOK has rebounded from its last support and seems to have begun its first upward movements.
The 0.3747 support was faked out, followed by a solid green candle with good volume that engulfed the previous candles , After activating the 0.5058 trigger, it is now heading toward 0.75.
For new entries, after breaking 0.7504, a buy opportunity can be considered. However, note that the stop-loss will need to be set quite wide at 0.3747. If the price consolidates or retraces, it could provide a better stop-loss level.
📊 Daily Time Frame
In the daily timeframe, after breaking 0.5103, the price moved upward but has recently shown signs of weakness , RSI is in the overbought zone.
The green candles are getting smaller, indicating a loss of momentum.
Despite this, with a valid trigger, a position can still be taken.
The 0.7562 level remains a trigger for buying , Alternatively, after a correction, a breakout above the current high (using Dow Theory) could justify entry with a better stop-loss level.
For those who bought at the 0.5103 trigger, holding the position is recommended as the price hasn’t moved significantly relative to the broader market.
🕒 4-Hour Time Frame
In the 4-hour timeframe, following the daily move, HOOK is consolidating in the range between 0.6588 and 0.6980. This consolidation might be preparing for the next move.
📈 Long Position Trigger
Breaking 0.6980 is a valid trigger for a long entry , It is advisable to keep a wide stop-loss to avoid being stopped out during minor corrections and to stay positioned for potential gains after the breakout.
📉 Short Position Trigger
No short positions are advised at the moment. Like recent market analyses, the focus remains on long opportunities, especially as Bitcoin holds strong above $80.
This concludes the technical analysis for HOOK. Stay patient and disciplined with your entries and stop-losses for this setup.
📝 Final Thoughts
This analysis reflects our opinions and is not financial advice.
Share your thoughts in the comments, and don’t forget to share this analysis with your friends! ❤️

Is HOOKUSDT Ready to Skyrocket or on the Verge of a Crash? Yello, Paradisers! Could #HOOKUSDT be gearing up for a major bullish breakout, or are we staring down the barrel of a steep drop? Let’s break down the key levels that could define the market’s next big move.
💎#HOOKUSDT has recently faced a strong rejection at the $0.6612 resistance level, a price point that has repeatedly acted as a significant barrier. While this rejection caused a temporary pullback, it doesn’t necessarily confirm a bearish trend. Instead, the action shifts to critical zones $0.5671 and $0.5293 which could determine whether we see a reversal or further decline.
💎The $0.5293 level aligns closely with the 0.5 Fibonacci retracement zone, often dubbed the “golden pocket.” Historically, this region serves as a pivotal area for price action. If HOOKUSDT stabilizes and consolidates here, it could act as the springboard for the next upward leg. Many traders are zeroing in on this area, anticipating a potential rally that could set the stage for new highs.
💎If the $0.5293 level doesn’t hold, the next support zone lies at $0.4512. A rebound at this lower demand zone could still preserve the bullish outlook, but a breakdown below $0.4512 would invalidate the setup entirely. Such a scenario could trigger a steeper decline, wiping out bullish sentiment and demanding traders exercise extreme caution.
It’s decision time, Paradisers. As the market flirts with these critical levels, patience and discipline will be your greatest allies. Wait for confirmations, whether you’re looking to ride the next breakout or hedge against a potential drop.
MyCryptoParadise
iFeel the success🌴

#Hook (SPOT) IN ( 0.3350- 0.4160) T. (1.5060) SL(0.3200)BINANCE:HOOKUSDT
entry range ( 0.3350- 0.4160)
Target1 (0.6680) - Target2 (0.8960)- Target3 (1.2403)- Target4 (1.5060)
SL .1D close below (0.3200)
______________________________________________________________
Golden Advices.
********************
* collect the coin slowly in the entry range.
* Please calculate your losses before the entry.
* Do not enter any trade you find it not suitable for you.
* No FOMO - No Rush , it is a long journey.
Useful Tags.
****************
My total posts
www.tradingview.com
1Million Journey
www.tradingview.com
www.tradingview.com
********************************************************************************************************************** #Manta ,#OMNI, #DYM, #AI, #IO, #XAI , #ACE #NFP #RAD #WLD #ORDI #BLUR #SUI #Voxel #AEVO #VITE #APE #RDNT #FLUX #NMR #VANRY #TRB #HBAR #DGB #XEC #ERN #ALT #IO #ACA #HIVE #ASTR #ARDR #PIXEL #LTO #AERGO #SCRT #ATA #HOOK #FLOW #KSM #HFT #MINA #DATA #SC #JOE #RDNT #IQ #CFX #BICO #CTSI #KMD #FXS #DEGO #FORTH # AST #PORTAL #CYBER #RIF #ENJ #ZIL #APT #GALA #STEEM #ONE #LINK #NTRN #COTI #RENDER #ICX #IMX #ALICE #PYR #PORTAL #GRT #GMT # IDEX #NEAR #ICP #ETH #QTUM #VET #QNT #API3 #BURGER #MOVR #SKL .

Is HOOKUSDT Preparing for a Big Move? Don't Miss This Key MomentYello Paradisers! Have you noticed HOOKUSDT broken out of the resistance trendline recently? This could be the setup we've been waiting for 👀
💎HOOKUSDT has broken out of its resistance trendline, and after a consolidation, it's showing signs of a Cup & Handle pattern, with bullish divergence strengthening the case for a potential upward move.
💎If HOOKUSDT breaks out and closes a candle above the resistance zone, this will validate the pattern, significantly increasing the probability of a bullish reversal from here.
💎However, in case of a retracement, a bounce from the support zone is likely, but to increase our probability, we’d want to see a bullish I-CHoCH (Internal Change of Character).
💎If the price breaks down and closes candle below the support zone, it will invalidate our bullish setup. In that scenario, it’s better to wait for clearer, stronger price action before making any moves.
🎖Patience is key here. Whether we see a breakout or breakdown, it’s important to follow the strategy and wait for high-probability setups. Consistency, not impulse, is how you succeed in this game.
MyCryptoParadise
iFeel the success🌴

Hooked Protocol Hits Bottom, Goes Green (726% Mapped)We are looking at Hooked protocol and I would love to say, "Hey look, here is the bottom..." etc. But there is something missing when the chart is really young. While the market is interrelated and what one does, the rest follows; it is hard to write certain things without the historical supporting data.
➖ This is an analysis for HOOKUSDT. The HOOKBTC trade-idea can be found at the 'Related publications' at the bottom of this post.
Hooked did hit bottom in August 2024, a new All-Time Low and the action we are seeing now is supported by really high volume. The highest volume ever.
Taking into consideration the broader market cycle; the 2025 bull-market, we can expect a new uptrend to develop for this pair.
Everything looks good. After buying, we just wait.
What would you do if there is a crash right after you just bought in?
There are three ways to approach such a situation.
1) Buy more.
2) Wait patiently.
3) Sell at a loss with the intention of rejoining at a later time.
Answer expanded.
1) If you are confident in your analysis and what Cryptocurrency has in store for us in the year 2025, buying more would be something easy to do. If you have the conviction that the market will grow, a drop can be used as an opportunity to get more coins at a lower price.
2) If no additional capital is available or simply your conviction about future events is not strong enough, you can simply wait it out, see how it goes. This way you will not increase your exposure but keep the position. Remember, in spot trading you are buying the coins, so nothing happens if we wait.
3) If one has experience and see the drop happening, selling is an option. One can sell right away with the intention to track the market procuring a better entry. This choice can lead to mistakes, anxiety and other problems. It requires timing, energy and knowledge to track the market and predict a new support level.
Of course, this is all theoretical. I've been on the other side and based on my experience, the best option is always to hold. Just hold thinking of the long-term. This tend to produce the best results because results are not only money based. Peace of mind can be as profitable as a few hundred ks. Some people pay millions for a few hours of peace... Some people cannot be peaceful no matter how much they pay.
Thank you for reading.
You are appreciated.
Namaste.


Hookusdt trading opportunityHOOKUSDT is currently trading within a downtrend channel, with price approaching the potential bottom of this range. We anticipate a possible reversal from this area, making it an opportunity to begin gradual accumulation. The plan is to start buying in the weaker accumulation zone and, if the price drops further, add more at the stronger support level. This setup is recommended only for spot trading, with the primary target set around the immediate supply zone, where we expect resistance.

HOOK/USDT Breakout WatchHOOK/USDT Breakout Watch 🚀
HOOK/USDT is nearing a critical point where a breakout could be on the horizon 📈. If the price manages to break above the key resistance and successfully retests it as new support, we could see a strong bullish move follow 💥.
🔍 Key factors to monitor:
1. Breakout confirmation: A clear close above the resistance level.
2. Retest: A solid hold at the breakout level, turning it into support.
3. Volume surge: Watch for a significant increase in volume to confirm momentum.
⚠️ Stay vigilant with this pair, but remember this is not financial advice. Always DYOR (Do Your Own Research) before making any moves. 📊

HOOKUSDT: Bullish SignalHOOKUSDT technical analysis update
HOOKUSDT has formed a triangle pattern on the daily chart, and the price is now moving towards a breakout. It has also crossed above the 100 EMA on the daily chart. A bullish move can be expected once the triangle breakout is confirmed.
Buy level: $0.50
Stop Loss: $0.44
Regards
Hexa

HOOK.USDT - 4HIt has very good conditions for price growth, we should monitor its exit to see which direction it will move

#HOOK (SPOT) entry range (0.3400- 0.4000) T.(1.5060) SL(0.3138)BINANCE:HOOKUSDT
entry range (0.3400- 0.4000)
Target1 (0.6680)- Target2 (0.8960)- Target3 (1.2403)- Target4 (1.5060)
SL .1D close below (0.3138)
*** Collect slowly in the entry range ****
*** wait the price to come to entry range***
**** #Manta ,#OMNI, #DYM, #AI, #IO, #XAI , #ACE #NFP #RAD #WLD #ORDI #BLUR #SUI #Voxel #AEVO #VITE #APE #RDNT #FLUX #NMR #VANRY #TRB #HBAR #DGB #XEC #ERN #ALT #IO #ACA #HIVE #ASTR #ARDR #PIXEL #LTO #AERGO #SCRT #ATA #HOOK ****

#HOOK (SPOT) entry range (0.4350- 0.4850) T.(1.5060) SL(0.4223)BINANCE:HOOKUSDT
entry range (0.4350- 0.4850)
Target1 (0.6680) - Target2 (0.8960)- Target3 (1.2403)- Target4 (1.5060)
SL .4H close below (0.4223)
*** collect the coin slowly in the entry range ***
*** No FOMO - No Rush , it is a long journey ***
**** #Manta ,#OMNI, #DYM, #AI, #IO, #XAI , #ACE #NFP #RAD #WLD #ORDI #BLUR #SUI #Voxel #AEVO #VITE #APE #RDNT #FLUX #NMR #VANRY #TRB #HBAR #DGB #XEC #ERN #ALT #IO #ACA #HIVE #ASTR #ARDR #PIXEL #LTO #AERGO #SCRT #ATA #HOOK #FLOW #KSM #HFT #MINA #DATA #SC #JOE #RDNT #IQ #CFX #BICO #CTSI #KMD #FXS #DEGO #FORTH # AST #PORTAL #CYBER #CLV #RIF ENJ #ZIL #APT #MAV #ZRX ****

HOOKUSDTHook has two scenarios.
Either it makes a last low to set a bottom for a new bullish journey, or it pumps directly from the current range without dropping to a new low.
Passing $0.555 is a soft cancellation of the new low idea.
The general idea is that Hook is good for the long term.

HOOKUSDTHOOK ~ 3D ✅
#HOOK it is only a matter of time that this descending pattern is successfully broken. minimum target of 20%++ for the short term.

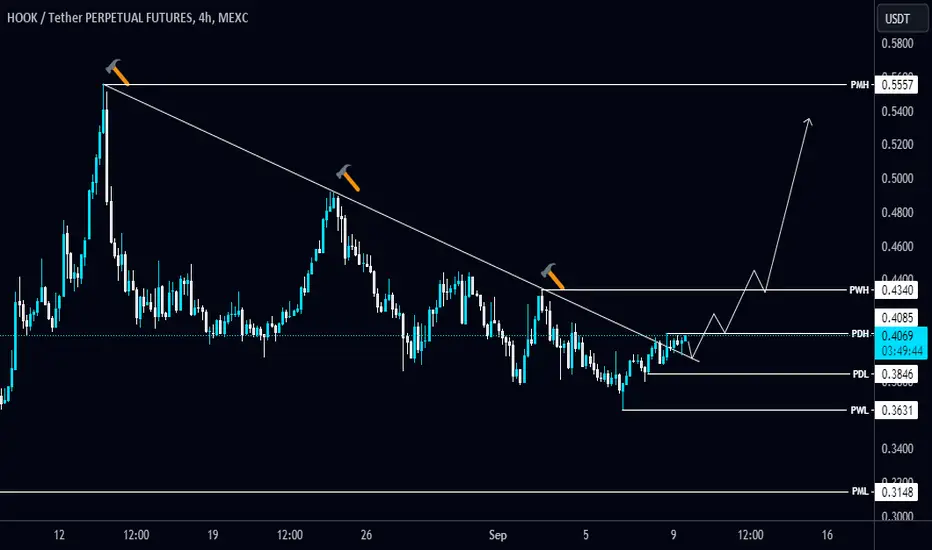
#HOOK/USDT breaks the Diagonal Trendline in 4-Hour TF!#HOOK/USDT breaks the Diagonal Trendline in 4-Hour TF!
NASDAQ:HOOK is holding above the trendline. #HOOKUSDT needs to reclaim PWH $0.434 as support. The local support level is PDL $0.3846.