HOT - Target - $0,09 - Double bottom break outHOT looks great on the weekly timeframe. The price has bottomed out and the comming weeks HOT can increase up to $0,09 as first next weekly target.
HOTUSDT trade ideas

HOLO (HOT) TECHNICAL ANALYSIS + TRADE PLANTechnical Analysis for HOLO (HOT) Cryptocurrency
Chart Overview:
The chart shows HOLO (HOT) trading within an ascending channel, which is a bullish continuation pattern. The ascending channel is characterized by two parallel trendlines: a support line at the bottom and a resistance line at the top, with the price generally moving upwards within these boundaries.
Key Observations:
Ascending Channel Pattern: HOLO (HOT) is trading in an upward-sloping channel, suggesting a bullish sentiment. The price has recently tested the channel's resistance line, facing a minor pullback, but remains within the channel, indicating potential continuation of the uptrend.
Support and Resistance Levels:
Support: The lower boundary of the ascending channel serves as the primary support level. If the price tests this line, it may present a buying opportunity.
Resistance: The upper boundary acts as resistance, where traders may take profit or anticipate pullbacks.
Volume Analysis: The recent volume spike aligns with a test of the upper channel resistance, suggesting stronger interest from traders. A sustained increase in volume on upward movements could confirm bullish momentum.
Technical Indicators:
VMC Cipher B Divergences: Indicates bullish divergences, which may signal a continuation of upward momentum.
RSI (Relative Strength Index): RSI is above 60, but not in the overbought zone, suggesting room for potential upward movement.
Stochastic Oscillator: Shows a minor pullback, with potential for reentry if the oscillator reverses from oversold levels.
HMA Histogram: Momentum appears to be weakening slightly, as indicated by a minor decline in the histogram. Continued monitoring is needed to confirm whether this trend is reversing.
Price Prediction:
If the ascending channel pattern holds, HOT may continue its upward trajectory. The next price targets are:
Short-term Target: $0.0022 - Near the top of the channel.
Medium-term Target: $0.0024 - If price breaks out of the ascending channel with strong volume.
Trading Plan:
Entry Points:
Rebound from Support: Consider entering long positions if the price tests and rebounds from the lower channel support.
Breakout Confirmation: Enter long if the price breaks above the resistance line of the channel with strong volume.
Exit Points:
Take Profit: Near the resistance line within the channel or at $0.0022 to $0.0024 if momentum is strong.
Stop-Loss: Set below the support line of the ascending channel to limit downside risk, around $0.0018.
Risk Management:
Position Sizing: Adjust based on risk tolerance, considering a stop-loss just below the support line.
Trailing Stop: Use a trailing stop if the price exceeds the channel's upper boundary to capture potential upside.

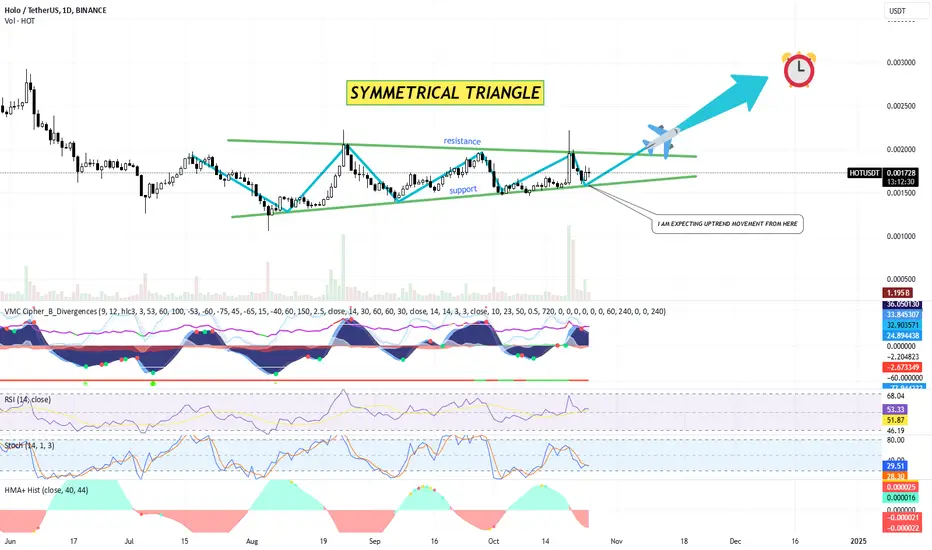
HOLO (HOT) AT GOOD ENTRY POINT TOWARDS UPTREND MOVEMENTSymmetrical Triangle Pattern: The chart illustrates a clear symmetrical triangle formation. This pattern generally suggests a continuation or breakout of the prevailing trend, but it could go either direction—up or down—depending on the market conditions and volume at the time of the breakout.
Resistance: The top boundary of the triangle has been identified as a resistance level around the 0.002000 USDT mark.
Support: The bottom boundary is acting as support around 0.001500 USDT.
The price is currently consolidating within these converging trendlines, suggesting that a breakout is imminent.
Indicators:
VMC Cipher B Divergences:
The VMC Cipher indicator is showing divergence, hinting at a potential change in momentum.
Positive divergences and green dots indicate buying opportunities, with bullish divergence supporting the breakout hypothesis.
Relative Strength Index (RSI):
Current RSI reading is around 53.55, indicating a neutral zone. There's no clear sign of overbought or oversold conditions. This means the price could go either direction, depending on momentum.
Stochastic RSI:
Stochastic RSI is at 30.09, showing a slightly oversold condition. This suggests that upward momentum might be gaining strength soon.
HMA (Hull Moving Average):
HMA Histogram is currently slightly negative but shows signs of recovery. If it flips to green, it would be another signal for an upward move.
Volume Analysis:
The volume is relatively flat, which is typical during the consolidation phase of a symmetrical triangle. A surge in volume, however, is expected when the price breaks out of the triangle, which will confirm the breakout direction.
Trading Plan for HOLO (HOT):
Scenario 1: Bullish Breakout from the Symmetrical Triangle
Entry Point:
A confirmed breakout above the 0.002000 USDT resistance level with increased volume.
Enter at 0.002050 USDT once the breakout is confirmed to avoid false breakouts.
Target Levels:
First Target: 0.002500 USDT (previous high).
Second Target: 0.003000 USDT, corresponding to the projected move from the triangle breakout.
Stop-Loss:
Place a stop-loss at 0.001800 USDT to protect against false breakouts back into the triangle.
Risk Management:
Consider allocating 2-3% of your portfolio per trade and adjust position size according to risk tolerance.
Scenario 2: Bearish Breakdown from the Symmetrical Triangle
Entry Point:
A confirmed breakdown below 0.001500 USDT with a spike in selling volume.
Enter at 0.001450 USDT once the breakdown is confirmed.
Target Levels:
First Target: 0.001200 USDT, which aligns with historical support.
Second Target: 0.001000 USDT.
Stop-Loss:
Place a stop-loss at 0.001700 USDT in case the breakdown is false.
Risk Management:
As always, only risk a small portion of your capital (2-3%) to avoid heavy losses in a volatile market.
Key Watchpoints:
Volume Confirmation: Watch for a surge in volume when the price nears either the upper or lower boundary of the symmetrical triangle. Volume is a key factor in confirming breakouts.
Market Sentiment: Keep an eye on overall market sentiment for both cryptocurrencies and broader financial markets, as HOLO could be influenced by market-wide movements.
#HOT/USDT#HOT
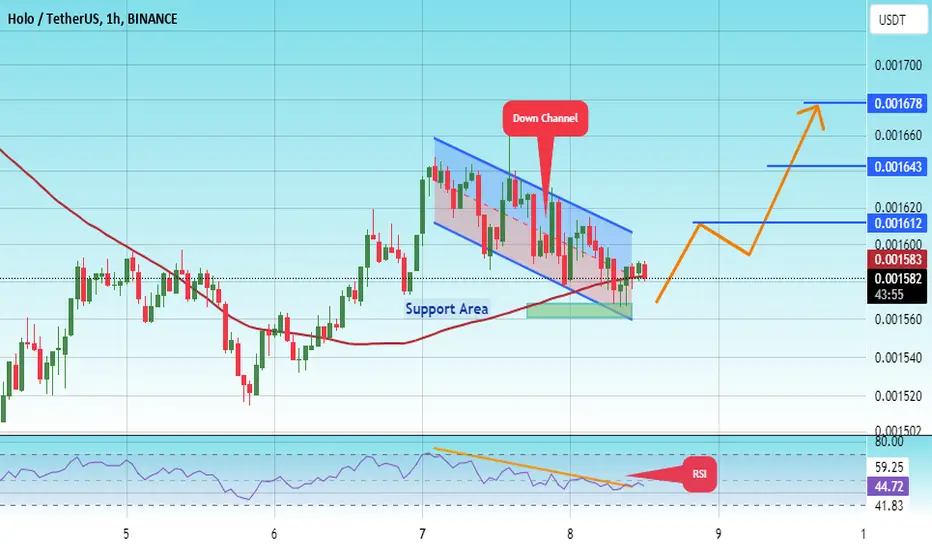
The price is moving in a descending channel on the 1-hour frame
And it is sticking to it well
We have a bounce from the lower limit of the ascending channel and we are now touching this support at a price of 0.001550
We have a downtrend on the RSI indicator that is about to be broken, which supports the rise
We have a trend to stabilize above the moving average 100
Entry price 0.001570
First target 0.001612
Second target 0.001643
Third target 0.001678
#HOT/USDT#HOT
The price is moving in a descending channel on the 12-hour frame and is sticking to it to a large extent and it was broken upwards
We have a bounce from the lower limit of the channel price 0.001440
We have an upward trend on the RSI indicator which supports the rise
We have a trend to stabilize above the moving average 100
Entry price 0.001600
First target 0.001800
Second target 0.001957
Third target 0.002135

HOLOCHAIN FALLING WEDGE PATTERNWe can see that a Falling Wedge pattern has formed and after the breakout and pullback we could expect at least 40% up to 140% for the following weeks so I am adding some HOT in this area to my spot portfolio.

$hot #hotusdt #holochain #holofuelI dont know what is gonna happen.
I draw just i saw and want too see what is gonna happen :)
this is not an financial advice.

HOLO (HOT) paired with USDT, focusing on a 4h tmeframeTechnical Analysis by Blaž Fabjan
Ascending Channel:
The price is moving inside an ascending channel with clear resistance and support lines. This channel is characterized by higher highs and higher lows, indicating an upward trend.
The price has previously bounced off the support line multiple times, confirming the validity of the ascending channel.
The price action is approaching the upper resistance line of the channel, which could act as a barrier for further upward movement unless broken.
Potential Scenario:
The chart suggests a pullback after testing the resistance, with the potential for the price to drop back to the support line of the ascending channel before resuming its upward momentum.
The upward arrow drawn on the chart indicates an expectation of a bullish continuation after the pullback.
RSI (Relative Strength Index):
The RSI indicator currently sits around 58, which is in the neutral zone, not showing overbought or oversold conditions. This suggests that there is still room for the price to move in either direction.
A possible future rise in the RSI towards overbought levels (above 70) would align with the forecasted bullish move.
Stochastic RSI:
The Stochastic RSI is above 80, indicating that the asset is in overbought territory. This supports the idea of a short-term pullback before another upward move.
Once the Stochastic RSI cools down and approaches oversold levels, it could signal a better entry point for a long position.
MACD (Moving Average Convergence Divergence):
The MACD is slightly bullish with some divergence, showing that momentum is in favor of buyers, but it's not very strong.
A potential bullish cross of the MACD signal lines could confirm further upside momentum.
Volume:
The volume seems relatively stable, although not significantly high. Higher volume on a breakout above the resistance line would confirm a stronger bullish trend.
Trading Plan:
Entry Point:
Wait for a pullback towards the support line of the ascending channel (around $0.00165 - $0.00160), which could provide a better entry point for a long position.
Confirm entry with a bounce off the support line, or when indicators such as the RSI or Stochastic RSI reach oversold conditions.
Stop Loss:
Place a stop loss below the support line of the channel, at approximately $0.00155, to limit losses in case of a breakdown below the channel.
Target:
First target: Resistance of the ascending channel (around $0.00180 - $0.00185). This aligns with the previous highs, offering a solid take-profit level.
Second target: If the price breaks above the resistance line with strong volume, the next target would be around $0.0020 or higher, following the bullish projection shown by the arrow in the chart.
Risk Management:
Ensure the risk-to-reward ratio is favorable, aiming for at least 1:2. For example, if risking 5% (stop loss at $0.00155), the first target should yield at least a 10% gain.
Confirmation:
Before taking any position, look for confirmation through price action, such as bullish candlestick patterns (e.g., bullish engulfing) or strong buy volume when the price touches the support line.
This trading plan outlines a potential setup based on the chart. However, always remember to adapt based on real-time market conditions and further confirmations from your indicators.

50$ SHITCOIN invest series - COIN 3 (HOT - HOLOCHAIN)I am not sure if its a shitcoin or not. But its behaviour has not been different.
As it is an L1 project, I think it can go at least 9X from current price.

HOT -50%HOT may drop -50% in September if the bear correction is true and open October with cheap prices.
Only price reading, crypto history probability and truth can really differ. BUT if i look at my many analyses, a decline can be probable.
Below the pink line.
It could all be wrong, but it could be the truth
MD

HOT Spot Trade | 2500 % or ATH in 2025🔥 HOT (Holo) is setting up for a massive 2500% surge or a new ATH in the 2025 bull run! With its unique decentralized hosting platform gaining traction, this could be a long-term winner. Don't miss the ride! 🚀 #HOT #Crypto #ATH"

Technical Analysis of Holo (HOT) 4H TIMEFRAME ON BINANCEHOT/USDT TECHNICAL ANALYSIS BY BLAŽ FABJAN:
Bullish Falling Wedge Pattern:
The price action indicates the formation of a falling wedge, which is a bullish reversal pattern. The wedge is marked by converging trendlines (resistance line and support line), with the price gradually tightening within the pattern.
The breakout from this wedge has occurred with a slight increase in price and volume, suggesting the start of an upward movement.
Momentum Indicators:
RSI (Relative Strength Index): The RSI is currently around 47.17, indicating neutral momentum. However, there is a slight upward slope, which suggests that momentum is shifting towards the bulls.
Stochastic RSI: The Stochastic RSI is at 78.15, near the overbought region, but not yet fully overbought. This could indicate a short-term pullback or consolidation before another upward move.
VMC Cipher Indicator: The VMC Cipher B divergences indicator shows bullish divergence, further confirming the potential for upward movement. The histogram is turning positive, which is a bullish sign.
Trading Plan:
Intraday Trading:
Entry: Consider entering a long position around the current price levels or upon a slight pullback, ideally around the 0.001580 - 0.001600 support zone.
Target: Target short-term resistance levels around 0.001750 - 0.001800.
Stop-Loss: Place a stop-loss just below the recent low or support level, around 0.001550.
Strategy: Focus on quick scalps and close positions if there is a lack of momentum.
Scalping:
Entry: Enter on minor dips or consolidation phases, particularly around the 0.001600 - 0.001610 range.
Target: Target small profit levels within 0.001630 - 0.001650 range.
Stop-Loss: Keep a tight stop-loss below the 0.001580 level.
Strategy: Utilize tight risk management and be prepared to exit quickly if the price does not move as expected.
Swing Trading:
Entry: Consider entering a long position on the breakout confirmation or upon a retracement back to the breakout zone (around 0.001600).
Target: Aim for higher resistance levels around 0.001900 - 0.002000 based on the measured move of the wedge pattern.
Stop-Loss: Place a stop-loss below the lower boundary of the wedge, ideally around 0.001500.
Strategy: Hold the position over a few days to weeks, depending on the price action and momentum.
Conclusion and Trading Advice for Long Position:
Bullish Outlook: The breakout from the falling wedge pattern suggests a bullish reversal. However, the RSI and Stochastic RSI indicators are neutral to slightly overbought, suggesting caution for overextension in the short term.
Trading Advice:
For Intraday and Scalping: Be prepared for quick trades and potential pullbacks. Ensure tight risk management due to the current levels of momentum indicators.
For Swing Trading: The breakout is promising for a larger upward move. It is advisable to enter on a pullback to minimize risk and target higher resistance levels.
This analysis suggests a cautiously optimistic outlook for HOT/USDT, with the potential for further gains, especially in a swing trading strategy. Always use proper risk management and adjust your strategy according to market conditions.

HOTUSDTWe can attempt to buy HOTUSDT from specified level as it makes HL , also there is no bearish divergence occur indicate that it moves upward.
SL , TP mention in chart.

#HOT/USDT#HOT
The price is moving in a descending channel on the 4-hour frame and is sticking to it very well and is expected to break it upwards
We have a bounce from a major support area in green at 0.001300
We have a downtrend on the RSI indicator that was broken upwards which supports the rise
We have a trend to stabilize above the 100 moving average which supports the rise
Entry price 0.001540
First target 0.001700
Second target 0.001850
Third target 0.002030

holochaunHt did a 18% today. I think will grow until the limit of 0.005 in the next couple of days.
I hope it reachs 0.03 that was my level

hot coin look good to go up hot coin look good to go up
entry 0.001696
SL 0.001664
TP
sorry i forgot to post this trade idea before


HOTUSDTHOT ~ 1W
#HOT demand zone that you might need to pay attention to to start buying if you have Conviction on this NASDAQ:COIN

HOTUSDTWe can attempt to short HOTUSDT from specified level as it break HL , also bearish divergence occur indicate that it moves downward.
SL , TP mention in chart.

where we are at sep23? what will be happened ? $hotHolo is very near to launch.
I found three important trend for us.
They are crossing at sep 23.
I am adding this for looking after sep 23.

HOTUSDT.1DAs I analyze the daily chart of HOT/USDT, several key patterns and levels stand out to me.
Resistance and Support Levels
Resistance Levels:
R1: The first significant resistance level is around $0.002171. This level aligns with previous highs and acts as a potential target if the bullish momentum continues.
R2: The next major resistance is around $0.002851, which marks a higher resistance point observed on this chart. This level will likely serve as a strong barrier to further upward movement.
Support Levels:
S1: The initial support level is at $0.001627, where the price has shown a tendency to bounce back after recent declines.
S2: A more robust support level is at $0.001261. If the price falls below this, it might indicate a more prolonged bearish phase.
Technical Indicators
Relative Strength Index (RSI):
The RSI is currently at 48.78, which is relatively neutral. This indicates that the market is neither overbought nor oversold at the moment. A move above 70 would suggest overbought conditions, while a drop below 30 would indicate oversold conditions.
Moving Average Convergence Divergence (MACD):
The MACD line is slightly above the signal line, with values of 0.00040 and -0.00938, respectively. This suggests a potential bullish crossover, which could lead to upward price momentum if confirmed by further movement.
Trend and Pattern Analysis
I have observed a harmonic pattern forming, which suggests a potential reversal zone around the current price levels. The completion of this pattern indicates that the price might head towards the resistance levels mentioned above.
The price has recently broken above a downward trendline, which adds to the bullish sentiment. If this breakout holds, it could pave the way for a move towards R1 and possibly R2.
Market Sentiment and Predictions
Given the current setup, my expectation is for HOT/USDT to test the resistance at $0.002171 in the short term. A successful break above this level could see the price aiming for the $0.002851 resistance.
Conversely, if the price fails to maintain its current levels, it might retest the support at $0.001627. A break below this could drive the price down towards $0.001261.
Conclusion
In conclusion, while the overall sentiment appears cautiously bullish, it is crucial to monitor the key support and resistance levels. The RSI and MACD indicators support a potential upward move, but confirmation from price action is essential. I will keep a close watch on these levels and adjust my strategy accordingly.

HOT ROAD MAPOn the HOT chart, we have 3 big ABC waves.
The time of wave A is about 416 days, the time of wave B is about 550 days.
It is expected that the time of C wave will last about 400-500 days.
It should be stated that HOT is very interested in triangle patterns.
Wave A was a contraction triangle.
Wave B was an expansion triangle.
Now wave C seems to have 3 waves. that wave a of C is an expansion triangle and we are now in wave b of C.
On the green range, it is observed that wave b of C will end and we will enter wave c of C.
The targets are clear on the chart.
Closing a daily candle below the invalidation level will violate the analysis.
For risk management, please don't forget stop loss and capital management
When we reach the first target, save some profit and then change the stop to entry
Comment if you have any questions
Thank You

#HOT/USDT#HOT
The price is moving below a downtrend on a 1-hour frame, and the trend is being tested now and is about to break to the upside.
We have a bounce from the green support area at 0.001260
We have a tendency to stabilize above the Moving Average 100
We have a downtrend on the RSI indicator that is about to break higher and supports the rise
Entry price is 0.001380
The first target is 0.001560
The second goal is 0.001680
The third goal is 0.001800
