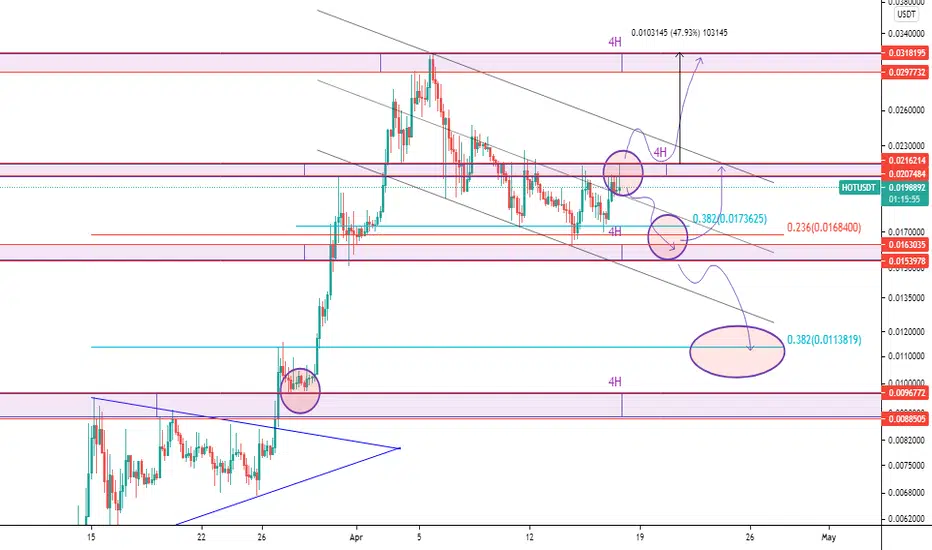
HOT is HOT? ;)Hello, I am publishing another idea on HOT. Last time, I said it seemed bullish, but did not break the triangle, so trend was not confirmed bullish. In that case the trend remained bear again, but seems as support (yellow lines) are holding pretty good. In general the market has been pretty volatile and HOT looking to recover and accumulate. As you can see from the chart, in general, HOT is very bullish in the long term, but I am going to talk about the short term and mid term scenario. In long term, you can enter anytime, as right now is a good moment. The white circle indicates and over pumped moment of HOT, as it was the FOMO.
FIRST SCENARIO- HOT jumps to the TP1- 0.019$ area and then continues the trend until 0.025$ area. IMO entry point should be somewhere between the 0.018-0.0195 area. Stop loss below 0.0173 area. In the mid term, if this scenario plays out, which is quite possible, new ATH is one the verge of coming soon.
SECOND SCENARIO- Not as possible as the first, but due to the volatility of the market, we can not leave without mentioning it. If it does not reverse the trend, we could see it drop to the 0.014 area first and then maybe to the 0.012 area, which will be a good entry point for another mid-term and short-term deal.
In long term, HOT has opened a very bullish pattern, with more peaks to be reached. In the short and mid term, you need to be a little careful trading and do not forget to put SL.
Do your own research too. Hope this has helped, if you have any other idea, you are free to comment. Good luck trading. :)
HOTUSDT trade ideas


What may happen to HOTHOT as shown I following a decending channel. Buy the breakout. Targets are midline and top of the channel


HOT/USDT : Pulled back from bearish trendline BINANCE:HOTUSDT
Hello everyone 😃
It seems that volatility wants to being bullish again !
It had a pullback from last broken bearish trendline.
Also it's above a support zone.
We expect a pressure on selling while HOT approaching MAs...
However some of the Indicators Specially volatility is being bullish on high timeframes ( 12H ) !!
🔴 We can say that market is recovering to reach 59K level on BTC;
Now everything is about recovery's duration...
Attention: this isn't financial advice we are just trying to help people on their own vision.
Have a good day!
@Helical_Trades

HOT 0.016-0.018 SUPPORTED HOT ZONE 0.016-0.018 supported well
and form a hammer look alike candle.
break above 0.018 would have further upside.

HOT 🔥OK so, beside the large number of supply in Holo coin it's obvious that this price is really interesting for buyers.
It's not a signal.
And one more thing >>> everything depends on BTC


HOT - buying the dipwe have a great RR here.
Entry at 0.017
Stop Loss below the swing low printed today
TP1 at the range high of 0.03.
TP2 at the fib 5 level of 0.06
not investment advice

Is Holo ready for another run??After a huge rise, Holo has released some presure over the last 2 weeks.
- Have seen price retrace back to the 0.618 fibs
- Break down through all ema's (besides 200) on the 4 hour chart
- Bearish divergance and also a smaller bullish divergance.
What I am looking at now
- Inverse Head and Shoulder's formed on the 4 hour chart - does it break above the red line or fail?
- current red candle is above all ema's and could be building some support here.
- overall target is the -0.382, lines up perfectly with measured move of last run.
Need price to break above the red resistance - lot of wicks everywhere, so want to be clear of those.
Needs to prove itself with some strength in the push.

HOTUSDT, Needs more correction or Not. HOLOHello my friends. Like always everything is clear on the chart for you. We have two scenarios, the price in the temporary descending channel and now under a strong resistance baseband, So I expect more correction to fib 0.32 If fails to break the baseband. Totally keep your eyes on the circles zone and watch the price's behavior at this areas. Good luck
If you like the idea, do not forget to support with a like and follow me for next analysis :)
Write your comment and opinion below for me
.
Salam be doostan. hame chiz rooye chart moshakhas hast. inja 2 ta senario darim ya shekast base band va roshde gheymat ya edame eslaah ta fib 0.32 ehtemalan. beshakhse entezar eslaah bishtar ro daram agar natoone moghavemat base band ro rad koneh. dar kol raftar gheymat tooye dayere ha ro rasad konid. moafagh bashid.
like va follow baraye hemayad va didan tahlil haye jadid faramoosh nashe :D
#Holo Breaks Strong Resistance in 4H Timeframe!Currently #holo has nicely reacted to it's 20EMA on daily timeframe . with the breakout confirmation in 4H timeframe , from a bull flag pattern , it is a good time to buy #Holo. headed to 0.618 golden fib. after volume confirmation, we expect the price to go as high as 0.06 as it's first target.
other scenario which in highly unlikely is: breaking down the strong support and hitting SL in 0.013.
Good Luck


HOTUSDT & KAVAUSDT : 4/17/2021Note: NOT A FINANCIAL ADVICE TO BUY/LONG OR SELL/SHORT
_____
In case not clear above
s3.tradingview.com
Relevant TA on this recent TA.
For HOTUSDT
For KAVAUSDT
____
Technical Analysis
For HOT (Continuation on previous TA)
1D
s3.tradingview.com
s3.tradingview.com
4HR
s3.tradingview.com
1HR
s3.tradingview.com
For KAVAUSDT
1W
Holding above EMA 9 for several weeks
s3.tradingview.com
s3.tradingview.com
1D
Bullish Convergence
s3.tradingview.com
4HR
s3.tradingview.com
1HR
s3.tradingview.com
______
Note: NOT A FINANCIAL ADVICE TO BUY/LONG OR SELL/SHORT


WHEN HOT BREAK RED LINEIt can blown when red line is cracked. green line and green zone strong areas. If green line broken, next target is orange line.
Targets 0.25, 0.30

HOTUSDT Daily chart , This is HOT!🔥😆Wait for trend line and resistance to break and hold above it then entering long and save profit in target 1
Good volume in 1H timeframe in this prices
Last time profit from this token was more than 80% in 4 days
I think history will happen again , even more profit this time!
Holo is a peer-to-peer distributed platform for hosting decentralized applications built using Holochain, a framework for developing DApps that does not require the use of blockchain technology. The goal of Holo is to serve as a bridge between the broader internet and apps built using Holochain, offering an ecosystem and marketplace in which DApps are easily accessible, as they are hosted on the internet by Holo network participants.
top 48 cryptocurrency on coinmarketcap.com

(HOT) TRIAGLE FORMATION PLUS INVERTED HEAD AND SHOULDERSHOT is forming an inverted head and shoulder formation after the break from a wider triagle.
When we detect this formations then the odds for the underline is to move higher.
So if we manage to break the neckline then we must see the underline to move to the first target (0.0217) and then to second target at 0.0226.
We want also to see high volume on the break of the neckline.
If we break the neckline and manage to consolidate betwwen 0.0217-0.0226 the we can set see higher price targets to 0.0247
