Hang Seng Tech Golden Pocket ResistancePotential 4 Bar Pattern setting up if unable to break 5000 today
Golden Pocket is Resistance as well as psych price Point.
HSTECH trade ideas

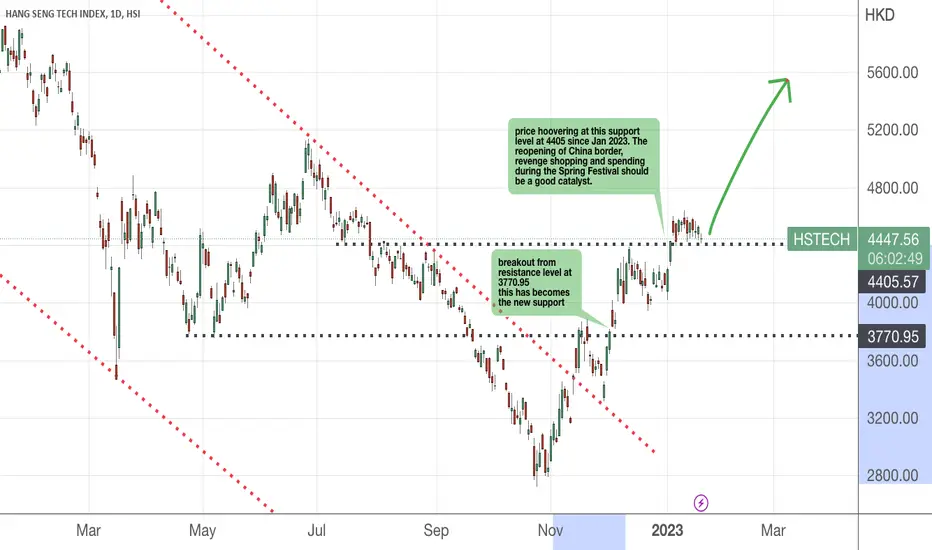
Hang Seng tech index breaks down Trend.Short term price action has formed higher highs and higher lows resulting in a breakout of the longer term downward channel,
This has been driven by recent gains off the lows of large cap stocks like Alibaba and JD. Com amongst others, may be beneficiaries if the index continues North.
Recent data out of China sounds more positive, Analysts have stopped predicting China’s economy is about to implode, quite something !

Hang Seng Tech Monthly TradeHI Guys, To me it looks like on monthly timeframe Hang Seng tech is bottomed up, as you can clearly see on this chart there is a clear bullish divergence on a montlhy timeframe as well as alot of index constituents are also showing bottoming formations
Script Stock Name Percentage
KYG017191142 Alibaba Group Holding Limited 10.00%
KYG875721634 Tencent Holdings Ltd 9.00%
KYG9830T1067 Xiaomi Corporation 8.50%
KYG8208B1014 JD.com Inc - Class A 8.50%
KYG532631028 Kuaishou Technology 7.50%
KYG5479M1050 Li Auto Inc 7.10%
KYG6427A1022 Netease Inc 6.90%
KYG596691041 Meituan-W 6.50%
KYG070341048 Baidu Inc - Class A 4.70%
HK0992009065 LENOVO GROUP LTD 4.20%
Any Long term investor can start accumulating on these levels

HSTECH low risk opportunityI will be going long on HSTECH. It has moved from 61.8% retracement with positive RSI divergence and closing marginally above 20 DMA and major resistance above 3750 area. More confirmation if closing above falling trendline. Will add above that.
Target will be swing high around 4300 and then 4800.

China Tech. Don't miss thisHang Seng Tech
Price broke out from a long-term down-sloping channel (since 2021).
the recent price advance since Oct 2022 shows a 5-wave impulsive move.
Therefore I believe the bottom is over.

3 days to Chinese New Year 2023!!!First thing first, I would like to take this opportunity to many of my followers who stayed by me all these years. You have given me the encouragement to continue writing my point of view over the last 5 years. Wow!!!
Looking back, it has been a roller coaster learning curve for me as well. For this year, I would like readers to embrace more changes ahead and take some concrete actions to change your life.
This is the starting point , click here
If you search online, there are many models on it, so be flexible in the application. Regarding the compartments, it may differs from everyone and thus if spirituality is not something you are in, then you can delete it.
I will focus mainly on MONEY since this is more investment related. Now, you can have a pie for CAREER and another one for MONEY. WHY ? Some of us may have a day/primary job that pays you a monthly salary and at same time, dabble in other freelance jobs after work and/or on weekends like waiting on tables, online business, investment, trading, property, forex, network marketing, writing, etc.
If you are an employee that draws a monthly salary, you may want to review this part of your career. Are you satisfied at where you are ? Are you in the right industry ? Are you passionate about what you do? (this is crucial as you can be 1000% passionate about what you do but the monetary rewards may not be there, eg nursing, healthcare, F&B,etc) These sectors at least in SG, are very much needed especially in an ageing country but the stress level are so high that turnover are at double digit figures. Of course, many could also leave because the money is not there!!!
This chart is powerful because it sets your priority straight and allow you to manage your time well according to your goals set. Example, if you intend to do trading/investment, then you need to spend time and set a goal. Where are you going to get the initial capital? How long do you want to see the returns ? What are your risk appetite ? Where can you go and acquire this knowledge ?
If you want to attend courses, how much are they are do you have the bandwidth ?
So, you see a lot of planning go into it. But, once you start the ball rolling, it gets easier over time.
For example, I have put aside some money into fixed deposits and bonds this year in view of the high interest rates. No one knows for sure when it is coming down. Meanwhile, banks here are enticing customers with good interest rates of up to 4 or more per cent. This is a no brainer so why not park some funds here while waiting for the coast to clear.
Another area that I am particularly keen on is the Tech sectors in China. So this ETF will be where I am going to accumulate on dips.
Now, I am a big fan of keeping oneself healthy and fit. I make an effort to swim 3-4 times a week and 1-2 times running. I know fully well when I am healthy, I can better focus on my work.
We only have 24 hours a day so it is important that we do what we truly like in life than to spend a life in regrets. Life is way too short for that !
3 more days to the Chinese New Year , the year of the Rabbit and I wish everyone - GONG XI FA CAI and may the Lord continue to rain prosperity, peace and abundance in your life. Be kind, be forgiving (towards self and others) and invest in yourself !!!!
Bottom fishing HSTECHIt is tough to determine the bottom for this ETF as it lacks historical trend to back up. Using the heaviest weightage component of this ETF to benchmark , Tencent appears to have reach a double bottom.
Of course, we won't know how long this bottoming process will last, weeks, months or years..... Those who believe in Tencent fundamentals and growth story may be motivated to accumulate in tranches.
Or the more cautious investors can wait for it to break out of the resistance level at 510.60 before going long. On the contrary , this HSTECH ETF has yet to display a bottoming pattern so it is good to wait a while more if one is keen to go long.
5862. 80 was perceived to be the bottom until proven wrong as the price actions has broken down from the support level. So, one can now wait for the prices to be stabilised or slightly heads further south before deciding to go long......

Hang Seng Tech Index: Rectangle May Hint at Trend ResumptionThe Hang Seng Tech Index appears to be carving out a Rectangle chart pattern on the 4-hour setting.
The ceiling seems to be at 4883 with the floor at 4300.
Breaking above could open the door to extending the mid-March bounce, but that would place the focus on a long-term falling trendline from February 2021.
The latter may reorient the index lower. On the other hand, clearing the trendline could open the door to a material change in trend.
Breaking under the rectangle exposes the 23.6% Fibonacci retracement at 4044 before the March low comes into play at 3463.
HSI:HSTECH

Hang Seng Tech Index has likely formed a "Double Bottom" Hang Seng Tech Index has likely formed a "Double Bottom" chart pattern, which is perceived as a trend-reversing indicator
The index has been consolidating for months, waiting for catalyst for a rebound
Yesterday, China's state funds shored up stock prices via open market interventions, buoying hopes that the market has bottomed out

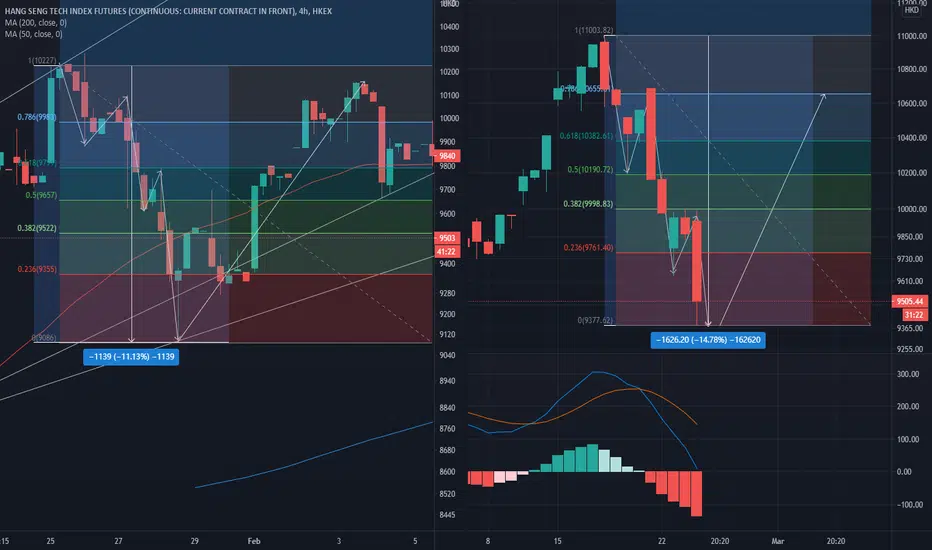
$HSTECH Bearish Engulfing day followed by Island ReversalHSI Tech reversal
$BABA showed weakness last week and again led to the complex reversal.
It seems the counter-trend rally may have come to an end.
$HSI also has a smaller degree Island Reversal as well. It should lead to some volatility here on.

HSTECH - Bottom fishingWith most of its components companies suffering a nosedive in prices, the index naturally is heading south too. A look at the chart reveals it is nearing its bottom and may be good for some of us who still believe in the China Tech stories.
I have mentioned previously that the regulations introduced by the Chinese Government is good for the long term of the industry and cleaning up to ensure fairer competition. This forces the companies to stand on its toes and constantly innovate and not being complacent.
If buying individual companies or analysing them is a hassle, then this index ETF may be suitable for you.
Please do your own due diligence.

Hang Seng Tech Index Attempts to Break key Resistance- The Hang Seng Tech Index is attempting to breach the ceiling of the "Descending Channel"
- A successful breakout may open the door for further upside potential and signal a bullish trend-reversal
- an immediate resistance can be found at 8,266 - the 23.6% Fibonacci retracement

Hang Seng Tech Index - Bullish MACD Convergence is forming- the Hang Seng Tech Index continued to trend lower within a "Descending Channel"
- bullish MACD convergence signals upside potential if the index breaks the ceiling of the channel
- the overall trend remains bearish-biased, and further consolidation is likely in the days to come
- the center line of the channel can be viewed as an immediate support

Hang Seng Tech Index May Breach the "Descending Channel"- the Hang Seng Tech Index is challenging the ceiling of the "Descending Channel". A successful try may open the door for further gains
- Positive MACD Convergence underscores upward momentum
- A pullback from here may intensify near-term selling pressure however

Hang Seng Tech: MACD Convergence Hints at a Potential Breakout - The Hang Seng Tech Index is trending lower within a "Descending Channel"
- Bullish MACD Convergence suggests that a potential breakout above the channel is likely as buying pressure accumulates


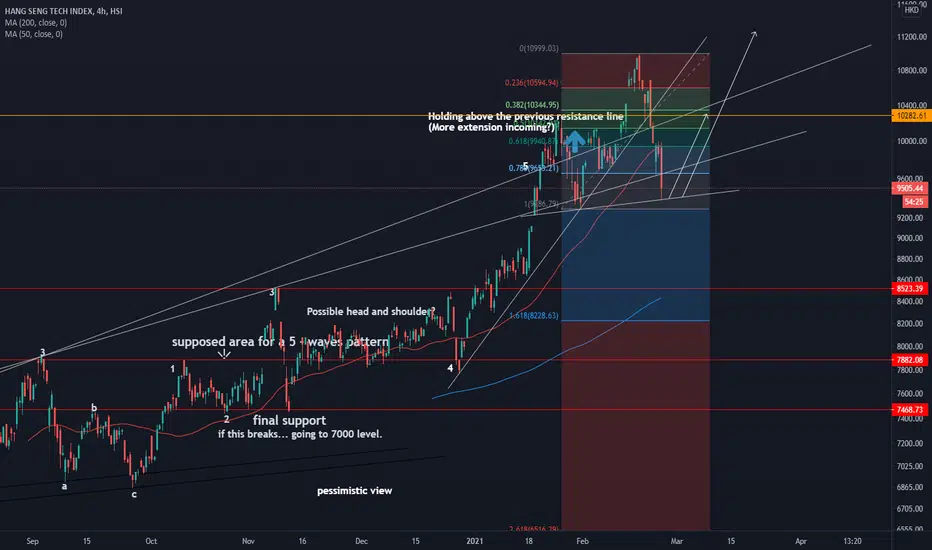
HSTECHHere you go. Free gift bump from Hang Seng Tech. TP 10300(if it's a head & shoulder). TP 11000 for a more optimistic outlook.
Update on HSTI: Level 4 support buying oppurtunityLong position oppurtunity on HSTI.
at strong level 4 support.

HSTI Long OppurtunityHSTI recently broke out of its peak resistance at 10,100 and extended up to 11,000.
There is a nice healthy 8.5% pullback to two strong support areas
- peak resistance turned to support
- Lower range band of 2 months upward trend
Pullback reasons include
- sector rotation to metals due to increased consumption
- sector rotation to Finance & Real Estate

New economy drives Hang Seng Tech Index to near 3-year highHappy CNY 2021. Hong Kong Hang Seng Index closes higher by 1.1% for the 2nd day after CNY holidays. Hang Seng Tech Index also rose by 2.34%. HKEX:9618 rose by 6.4%, HKEX:6618 +5.8%, HKEX:3690 +2.78%. Fast-growing new economy continues to drive HSI.

Strong ! Hong Kong HS Tech IndexJust keep Long Positions ! It would be a good chance to long if correction happen.

Start to think about covered callJust spent 1.5 day to reach the top of the ascending channel. Keep long positions and think about covered call to hedge it. Make 0.1-0.2 delta should be a right way.
