Bitcoin CME Futures Daily Trend AnalysisMarkets move in cycles, and different cycle durations help confirm trends ranging from short-term to long-term. Based on my analysis of the 5-day cycle, the Bitcoin CME Futures show a bearish signal. This suggests that the closing price on May 16, 2025, is likely to be lower than the opening price on May 13, 2025, which is 103100.
The current trend remains bullish, with a trailing stop-loss placed at 101059. A close below this level would confirm a sell signal.
Disclaimer: This is my personal market view and not a buy or sell recommendation. Traders should conduct their own technical analysis and follow sound risk management practices before taking any position.
BTCUSD11N2025 trade ideas

BTC CME Gap in Play – Will It Pull Price Lower?📉 BTC CME Gap Alert
There’s a visible gap between 91,950 and 92,560—these often act like magnets, with price revisiting them more often than not. 🕳️
🔍 Why It Matters:
CME gaps tend to get filled, especially in trending markets.
🎯 What to Watch:
If BTC shows signs of weakness near local highs, a short-term move toward this gap is possible.
🚨 Stay alert—this zone could offer entry opportunities or fakeouts before further upside develops.

Big, but biggerIn fact, I think it's possible that BTC will leave a CME gap (yellow box) unfilled for the first time since October 2020, and that we're repeating the marked 2020 fractal in a much bigger way.

War of gapsBTC decided to fill the CME gap at 97.3k first, while the gap at 92k remains unfilled, what makes a retracement to 92k at some point still highly likely since CME gaps almost never remain unfilled.

POT Long play $BTCUSDIf by the time that this demand zone get's hit, the red line (retailers) are bearish and atleast 20% line, I'll go for a long play at that Demand zone

Bitcoin: Strength Within the TrendThe Bitcoin chart continues to look constructive, showing strength within a long-term uptrend that’s been in place since 2021.
🔍 While the daily chart may not tell the full story, a look at the weekly chart reveals the bigger picture:
✅ Price recently bounced off the 55-week moving average
✅ Structure remains intact and bullish
✅ The market looks well-positioned to retest the January 2025 high at $110,150
🎯 Longer-term target: Top of the uptrend channel around $113,000 and rising
This long-term view suggests the next leg higher could already be underway.
Disclaimer:
The information posted on Trading View is for informative purposes and is not intended to constitute advice in any form, including but not limited to investment, accounting, tax, legal or regulatory advice. The information therefore has no regard to the specific investment objectives, financial situation or particular needs of any specific recipient. Opinions expressed are our current opinions as of the date appearing on Trading View only. All illustrations, forecasts or hypothetical data are for illustrative purposes only. The Society of Technical Analysts Ltd does not make representation that the information provided is appropriate for use in all jurisdictions or by all Investors or other potential Investors. Parties are therefore responsible for compliance with applicable local laws and regulations. The Society of Technical Analysts will not be held liable for any loss or damage resulting directly or indirectly from the use of any information on this site.

WEEKLY ANALYSIS FOR BITCOIN/BT/BTCBitcoin is one everyone's radar with analysts expecting another bullish run. Prices are definitely looking bullish and I'm on board with the thesis that new highs will soon be delivered, but for now I'm bearish on the next week and think you can enter on better prices.

Could the gap remain unfilled?If BTC doesn't fill the CME gap at around 92K, it will be the first unfilled CME gap since October 2020.

From Scanner to Trade: Full Workflow GuidesFrom Scanner to Trade: Full Workflow Guides
Table of Contents
Introduction
Why a Full Workflow is Crucial for Consistent Trading
Step 1: Defining Your Edge-What to Scan For
Step 2: Setting Up Scanners in TradingView
Step 3: Filtering & Ranking Potential Trades
Step 4: Deep Analysis-Technical, Fundamental, and Sentiment Checks
Step 5: Planning the Trade-Entries, Exits, and Risk
Step 6: Executing the Trade and Real-Time Adjustments
Step 7: Trade Management-Monitoring and Adapting
Step 8: Post-Trade Review and Journaling
Step 9: Tips, Case Studies, and Advanced Workflows
Conclusion: Making the Scanner-to-Trade Workflow Your Own
Introduction
What separates a consistent trader from someone who hops between strategies, never seeing results? Workflow.
The difference is as dramatic as preparing a gourmet moussaka with carefully layered ingredients versus tossing random ones into a pan.
As passionate trading tool creators, we know the power of process . Yet, most TradingView users stop at scanning for new tickers, rarely following a structured approach from scanning to trade selection , execution , and review . That’s where this in-depth guide comes in.
This article will walk you through a step-by-step workflow , using TradingView’s powerful features and easy-to-follow frameworks to help you transform from a chart-hopper into a methodical trader.
Let’s get started!
Why a Full Workflow is Crucial for Consistent Trading
Before we break down the process, let’s understand why a workflow matters.
Eliminates Guesswork : A workflow ensures every trade passes the same high standards, reducing emotional decisions.
Saves Time : Systematic filtering and ranking quickly highlight the best opportunities.
Improves Results : Backtests show that traders using a structured workflow outperform those who pick trades impulsively.
Enables Review : Every step can be reviewed post-trade, so you always know what worked and what didn’t.
The workflow is your trading “recipe.” Follow it, tweak it, and the results will come.
Step 1: Defining Your Edge-What to Scan For
Your workflow begins before you scan. First, define what you want to find. Are you a breakout trader, mean-reversion specialist, or a momentum chaser? Your edge -the reason you believe you can profit-should drive every scan.
Ask Yourself:
Do I want to catch squeeze breakouts with momentum?
Am I seeking multi-timeframe trend alignment?
Are volume spikes important for my entries?
Do I care about a stock’s fundamentals or just the chart?
Case Study: Finding Squeeze Momentum Setups
Suppose you love the squeeze momentum strategy. Your scanner should look for:
Low Bollinger Bandwidth (market coiling up)
Rising momentum (e.g., MACD turning up)
Volume spike confirming interest
This is your “ingredient list”-customize it to your taste and strategy.
Step 2: Setting Up Scanners in TradingView
TradingView’s Stock Screener is powerful, yet many traders barely scratch the surface. Here’s how to go beyond the basics.
2.1 Launching the Screener
Open any TradingView chart.
Click the Screener tab (bottom panel).
Choose Stocks , Crypto , or Forex according to your focus.
2.2 Customizing Your Filters
Set market (e.g., NASDAQ, NYSE, Crypto Top 100).
Add technical filters: price change %, RSI, MACD, volume, volatility, and, if available, squeeze momentum values (e.g., your custom script output).
Add fundamental filters if needed: EPS growth, P/E ratio, market cap, etc.
Example Setup: Squeeze Momentum Breakout Scan
Market: US stocks (selected in the screener)
Liquidity Filter: Volume × Price > 100M USD (focuses on liquid stocks and avoids thinly traded names)
Volatility & Momentum Filter: Vol Change > 10% (captures stocks with significant recent movement)
Minimum Price Filter: Price > 10 USD (to avoid penny stocks and illiquid tickers)
Volatility Squeeze Condition: 1. Bollinger Bands (20, 1 day) Lower above Keltner Channels (20, 1 day) Lower, and 2. Bollinger Bands (20, 1 day) Upper below Keltner Channels (20, 1 day) Upper (classic squeeze setup: BB inside KC highlights contraction/ready-to-expand momentum)
Calibration isn't about being perfect-it's about making your tools work better for specific markets.
2.3 Saving and Automating Your Scanner
Save your screener settings as a preset ( Save Screener Template ).
Set up alerts (once this feature becomes available in TradingView) so you’ll be notified when a new ticker matches your criteria.
Step 3: Filtering & Ranking Potential Trades
Your scanner likely spits out dozens of results. Time to filter and rank them, so you focus only on the “cream of the crop.”
3.1 The First Pass-Eliminate Noise
Skip tickers with low liquidity (e.g., daily volume < 100,000 shares for stocks).
Ignore assets with unreliable price action (wide spreads, frequent gaps).
Check for major news events or earnings that could cause unexpected volatility.
3.2 Ranking Your Candidates
Prioritize by:
Strength of signal (e.g., squeeze + multi-timeframe trend alignment)
Volume surge (higher is better)
Relative strength vs. benchmark (e.g., SPY, BTC)
Proximity to strong support/resistance (closer is often better for risk/reward)
Pro Tip: Create a Scorecard
Assign 1–5 points for each criterion and total up scores for each ticker. Focus on the top 3–5 results.
Don’t just “feel” your top picks-score them for objective clarity!
Step 4: Deep Analysis-Technical, Fundamental, and Sentiment Checks
With ranked candidates, now perform a deeper dive. This is where your experience and favorite tools come into play.
4.1 Charting and Technicals
Apply your key indicators (e.g., Squeeze Mom, Power Trends, Volume Profile).
Check price structure: higher highs/lows, base breakouts, wedges, etc.
Look for confluence: do different indicators and patterns agree?
4.2 Multi-Timeframe Confirmation
Check setup validity on daily, 4H, and 1H charts.
Does the larger trend support your trade, or are you trading against momentum?
4.3 Optional: Fundamental & Sentiment Checks
Is the company reporting earnings soon? Any big news?
For crypto, is there on-chain or social sentiment you should know about?
Example Workflow:
Chart 1: Daily Squeeze setting up, MACD positive, volume picking up.
Chart 2: 1H uptrend confirmed, minor pullback for entry.
News: No earnings for two weeks-less risk of surprise.
Step 5: Planning the Trade-Entries, Exits, and Risk
Now that you have a shortlist of well-vetted opportunities, it’s time to craft a plan. Failing to prepare is preparing to fail-so we layer in precise entries, realistic targets, and robust risk management.
5.1 Entry Strategies: The Art of Timing
Your scanner found potential, but your entry determines your reward-to-risk. Here’s how to approach it on TradingView:
Breakout Entry: Place buy-stop orders just above resistance or the squeeze “release” point.
Pullback Entry: Wait for a retrace to moving average or previous support, then enter on bullish reversal candle.
Confirmation Entry: Wait for indicator confirmation (e.g., Squeeze firing, MACD cross, volume surge) before pulling the trigger.
Great entries are less about prediction and more about preparation and confirmation.
Visualizing Your Entry
Draw horizontal lines at anticipated entry points ( Alt + J hotkey). Use TradingView’s “long position” tool to visualize profit/loss zones.
5.2 Setting Targets: Aim for Realistic Wins
Don’t hope-measure! Define exits before entering so emotion doesn’t sabotage your plan.
Price Target: Project a move based on past squeeze breakouts (e.g., last breakout ranged $4, set target for similar move).
ATR (Average True Range): Use ATR to estimate typical moves and avoid setting targets too far or too close.
Fibonacci Extensions: Use Fibs to find likely resistance/support for partial profits.
5.3 Stop Losses: Defend Your Capital
Risk management is your lifeline. Set stops where the trade idea is invalidated-not just at arbitrary numbers.
Below previous support or swing low (for long trades).
At technical invalidation-e.g., squeeze fails and price dips below the setup.
ATR-based stop (e.g., 1.5x ATR below entry).
Trade Example:
Entry: Breakout above $100.
Stop Loss: $97 (previous support, 1.5x ATR).
Target: $104 (measured move from last squeeze).
5.4 Position Sizing: How Much to Risk?
Golden Rule: Risk only a small percentage of your trading capital per trade.
Standard: 1–2% of account per trade.
Use TradingView’s position tool to measure.
Calculate shares/contracts based on distance from entry to stop.
Position sizing is the invisible lever that controls your trading destiny.
Step 6: Executing the Trade and Real-Time Adjustments
Execution bridges planning and reality. Even the best plans need discipline, fast reflexes, and the willingness to adapt if markets shift.
6.1 Entering the Trade: Be Precise
Use limit or stop orders, not market orders, to avoid slippage-especially in fast-moving assets.
Review your parameters one last time.
Set alerts using TradingView’s Alarm Clock icon for your entry, stop, and target.
// Basic Alert Example in Pine Script
if (ta.crossover(ta.sma(close, 9),ta.sma(close, 21)) )
alert("Bullish crossover detected", alert.freq_once_per_bar)
6.2 Monitoring During the Trade
Keep emotions out-let the process work. However, always watch for:
Sudden news events or market shocks.
Volume surges against your position.
Reversal candles (e.g., bearish engulfing at target zone).
6.3 Adjusting On-the-Fly
Sometimes, price action demands flexibility:
Move stop to break-even once price moves in your favor.
Scale out (sell a portion) at first target, let the rest run.
Exit early if your setup is invalidated (e.g., heavy volume reversal).
Adaptation is not abandoning the plan-it’s respecting the market’s message.
Step 7: Trade Management-Monitoring and Adapting
Trade management is an art that separates amateur from pro.
7.1 Trailing Stops and Locking Profits
Use trailing stops (fixed % or ATR-based) to lock in gains if price runs well past your target.
TradingView’s “long/short position” tool helps visualize your risk/reward as price moves.
7.2 Scaling In/Out
Scale in: Add to winners on confirmed strength (e.g., after strong breakout retest).
Scale out: Sell partial positions at key resistance/fib levels.
7.3 Dealing With Adverse Moves
If stop hit, close trade-review, don’t revenge trade.
If setup changes dramatically (e.g., news reversal), consider exiting early.
The best traders protect profits, not egos.
Step 8: Post-Trade Review and Journaling
By now, you’ve completed the trade-but the learning (and edge-building) is just beginning.
8.1 Review Every Trade: The Secret to Improvement
Did you follow your plan? If not, why?
What worked? What didn’t?
Were your scanner criteria effective?
Was your sizing/risk on point?
8.2 Journaling Your Workflow
Create a trade journal, either in TradingView’s notes or external tool (Notion, Google Sheets, etc.)
Screenshot entry/exit with annotations.
Log your scanner triggers and reasoning.
Add psychological notes: Were you calm or emotional?
Tag setups: “Earnings Squeeze,” “Breakout,” etc.
A detailed journal is your best trading mentor.
8.3 Performance Analysis
Periodically review your logs to spot patterns:
Which setups yield best R/R?
Where do you most often break your rules?
How does time of day/market impact outcomes?
Step 9: Tips, Case Studies, and Advanced Workflows
9.1 Expert Tips for Workflow Success
Automate alerts for scanner triggers-don’t stare at screens all day.
Batch your research (e.g., scan every evening, then focus only on finalists).
Develop a pre-trade checklist (see sample below).
Refine regularly: Tweak scanner filters as markets evolve.
// Sample Pre-Trade Checklist as Comments
// 1. Is the squeeze setup clear on multiple timeframes?
// 2. Is volume confirming the move?
// 3. Any major news/earnings ahead?
// 4. Stop loss + target realistic?
9.2 Real-World Case Study: Squeeze Momentum on TSLA
Imagine your scanner spits out NASDAQ:TSLA due to a tight squeeze and surge in volume.
Analyze the chart: Daily chart shows a strong squeeze setup with multi-timeframe squeezes firing bullish momentum (see the MTF Squeeze dashboard and green histogram). Volume spikes confirm buying interest. The 4H and daily timeframes are both aligned to the upside.
Check Earnings: Earnings are 30 days away, reducing the risk of event-driven surprises.
Trade Setup: Set entry just above the most recent swing high ( $197.5 ), with stop-loss below the support and squeeze base ( $186 ). The initial profit target is set at a measured move near $220 (prior swing high resistance and typical squeeze expansion).
Manage the Trade: Enter on breakout above $197.5; once price reaches around $208–$210, move stop to break-even. As price hits $220, sell half and trail the remainder using the 4H ATR or dynamic support.
Journal: “Setup fired as per screener and indicator alignment: volume spike, momentum, and squeeze breakout confirmed. Exited partial at target, managed risk throughout.”
9.3 Advanced: Multi-Timeframe, Multi-Asset Workflow
Combine scans across different assets (stocks, crypto, forex) using saved screener presets for catching opportunities globally. Create custom “watchlists” for different strategies, and rotate focus based on market conditions.
Stocks: Focus on squeeze breakouts.
Crypto: Seek mean reversion in sideways markets.
Forex: Look for multi-timeframe trend alignment.
Conclusion: Making the Scanner-to-Trade Workflow Your Own
Trading is not about prediction, but process. The difference between hope and edge is workflow-layered, adaptable, and reviewable.
By mastering the scanner-to-trade workflow, you can:
Act with confidence, not hesitation.
Avoid missed wins and costly emotional losses.
Turn complexity into clarity-one structured step at a time.
Start simple, layer in complexity as your skills grow, and let your journal be your improvement compass. The recipes here are just a foundation-make them your own, adapt them for your tools, markets, and goals.
Your next high-quality trade is just a repeatable workflow away.
Happy trading and happy building!

NEW CME GapWe got a new CME Gap in the 1H Chart.
Currently its the second open CME Gap. The other one is still at 20.000$

Well, Large Speculator Did it Again Trading BitcoinWell, Large Speculators did it again. They covered their longs, went net-short last week, and Bitcoin continued to rally now ~20% higher than the recent lows two weeks ago. That is when Large Specs first covered half their longs. It would be an impressive record if they continue to sell as Bitcoin makes news highs, which has happened a few times in the past few years and added great fuel to the rally.
Although not yet back tested, the number of times Large Specs were wrong when they were net-long Bitcoin the last few years is significant. Curious to see what they do this week, which we will find out about on Friday when the CFTC releases the new COT data and we get to look at the charts.

Mastering volume bars – How to read and use volume bars!When it comes to trading, price action often takes the spotlight, but volume is the quiet force behind the scenes that tells the real story. Volume bars show how much trading activity occurs during a given time period and can offer valuable insight into the strength or weakness of a price move. In this guide, we’ll break down how to read volume bars, what the different colors represent, and how to use them to make more informed trading decisions. Whether you're a beginner or looking to sharpen your strategy, understanding volume is a key step toward becoming a more confident and capable trader.
-------------------------------
What will we discuss:
- What is the volume indicator?
- What are the green and red volume bars + the MA line?
- How does the volume indicator work?
- How to use volume during Support/resistance flips?
- How to use volume while trading pattern breakouts?
- How to use volume while trading inside a pattern?
-------------------------------
What is the volume indicator
The volume Bar indicator is a simple but yet essential tool that helps traders understand the level of activity behind every price movement. When you add the Volume Bar indicator to your chart, you will see vertical bars appear beneath each candlestick under in your chart. This represents the total volume during that time period. These bars show how much buying and selling occurred, but not whether it was mostly buying or mostly selling. The taller the bar, the more active the market was during that candle.
-------------------------------
What are the green and red volume bars + the MA line?
A green volume bar means the price closed higher than it opened during that period, indicating bullish sentiment and suggesting that buying pressure was stronger. A red volume bar means the price closed lower than it opened, reflecting bearish sentiment and suggesting that selling pressure dominated. While the volume itself shows how much was traded, the color tells you whether that activity occurred mostly during upward or downward price movement. It's important to note that the color doesn't directly show the number of buyers or sellers, since every trade has both.
The MA line in a volume bar indicator stands for “Moving Average.” It represents the average trading volume over a specific number of past periods, smoothing out short-term fluctuations to show the overall trend in volume activity. This helps traders see whether the current volume is unusually high or low compared to the average. For example, if the current volume bar is significantly higher than the MA line, it could signal strong interest or momentum behind a price move. Conversely, if volume is consistently below the MA line, it may indicate weak market participation or a lack of conviction behind recent price changes.
-------------------------------
How does the volume indicator work?
Using volume effectively in trading involves looking at how it behaves in relation to price. For example, if price is moving up and volume is increasing , that usually confirms strong buying interest, suggesting the move is valid. On the other hand, if price rises on low volume, it could be a sign of weakness or a potential reversal. The same logic applies to down moves, if price drops on high volume, it is more likely a strong selling move. If it drops on low volume, it could just be a temporary pullback.
-------------------------------
How to use volume during Support/resistance flips?
Volume can also play a key role when trading support and resistance levels. When the price breaks through a key resistance level with strong volume, it often signals a shift in market sentiment and increases the likelihood that this level will now act as support. The high volume behind the breakout indicates strong conviction from buyers, meaning bulls were actively stepping in to push price higher.
Because of this, if the price comes back down to retest that zone, it's likely that buyers will defend it, turning the former resistance into solid support. This concept is often referred to as a "break and retest" strategy, and volume is what helps confirm whether the breakout was strong enough to validate the level as a new base.
Without significant volume, the breakout might lack follow-through, and the price could easily fall back below the level, failing to establish it as support. But when the breakout is backed by high participation, the probability of that level holding increases. I’ve included an example to show exactly how this plays out in action.
-------------------------------
How to use volume while trading pattern breakouts?
When trading chart patterns, volume can be a powerful tool to confirm whether a breakout is genuine or likely to be a fake-out. Patterns like triangles, flags, head and shoulders, or rectangles often lead to breakouts, but not all of them are trustworthy. That’s where volume comes in.
If price breaks out of a pattern, it's important to look at the volume at that moment. A strong breakout is usually accompanied by a noticeable increase in volume. This surge in volume indicates that more market participants are getting involved, adding weight to the move. Essentially, higher volume reflects stronger conviction. It means traders aren’t just watching the breakout, they’re actively trading it.
On the other hand, if the price breaks out but the volume remains low or even drops, that’s a red flag. Low volume suggests a lack of interest or commitment, and the breakout may not have enough strength to continue. In such cases, the price might quickly fall back into the pattern, turning what looked like a breakout into a fake-out.
-------------------------------
How to use volume while trading inside a pattern?
You can also use volume to gain insights while the price is still developing within a chart pattern, such as a rising wedge. In these situations, volume can help reveal the strength, or lack of strength, behind the price movement, even before a breakout occurs.
For example, if the price drops sharply with high volume and then starts moving upward again in a rising wedge formation, but this upward move happens on low or declining volume, it can be a sign of potential weakness. The initial high-volume drop shows strong selling pressure, and the lack of buying volume on the recovery suggests that buyers are not fully supporting the move.
This imbalance between strong selling and weak buying can indicate that the upward movement is not sustainable. It often means the rising wedge is forming as a corrective or weakening structure, increasing the chances of a breakdown once the pattern completes. In this way, volume becomes a clue, not just for breakouts, but for spotting when a move might be running out of steam even before it happens.
-------------------------------
Thanks for your support.
- Make sure to follow me so you don't miss out on the next analysis!
- Drop a like and leave a comment!

Bitcoin: Correction or New Breakout?We’re revisiting the Bitcoin chart today as price action hints at upside within the broad sideways range we've seen since early 2025.
But is it just noise… or something more meaningful?
🔎 Zooming out to the weekly chart reveals:
📈 BTC has been in a long-term uptrend channel since 2021
📉 The recent weakness? Likely just a correction
✅ Price held above the 55-week moving average
✅ Price also held above the midpoint of the up channel
What this suggests:
The market is holding key support levels and appears ready to resume its uptrend.
🎯 Near-term target: January 2025 high at $110,150
📌 Bigger picture: A potential breakout above that could take BTC towards the top of the channel – currently near $113,000, and rising monthly.
⏳ Watch for strength and confirmation on the weekly close.
Disclaimer:
The information posted on Trading View is for informative purposes and is not intended to constitute advice in any form, including but not limited to investment, accounting, tax, legal or regulatory advice. The information therefore has no regard to the specific investment objectives, financial situation or particular needs of any specific recipient. Opinions expressed are our current opinions as of the date appearing on Trading View only. All illustrations, forecasts or hypothetical data are for illustrative purposes only. The Society of Technical Analysts Ltd does not make representation that the information provided is appropriate for use in all jurisdictions or by all Investors or other potential Investors. Parties are therefore responsible for compliance with applicable local laws and regulations. The Society of Technical Analysts will not be held liable for any loss or damage resulting directly or indirectly from the use of any information on this site.

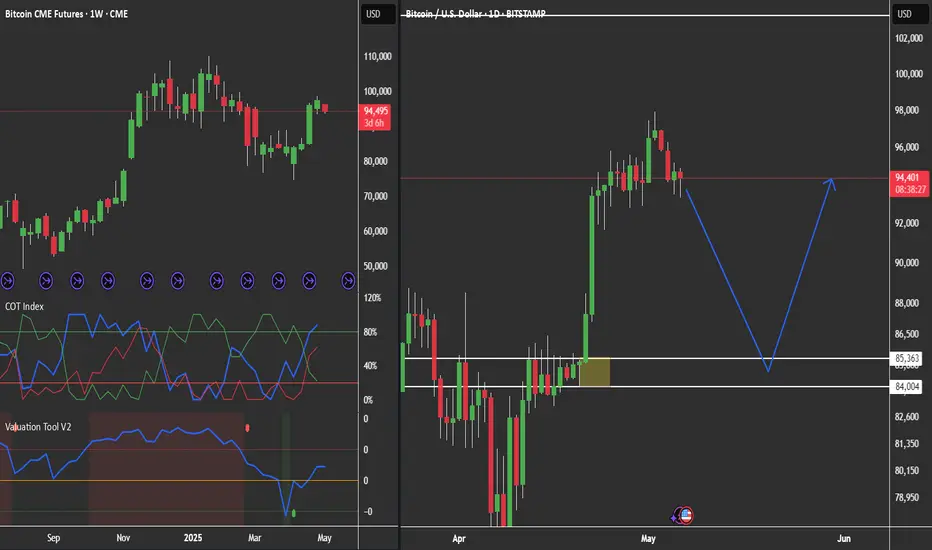
Bitcoin - CME Gap fill before going up ?Bitcoin CME Futures have formed a clear CME Gap in the $91,600 – $93,400 zone (highlighted in blue). Historically, these gaps tend to get filled before the price resumes its trend.
Price may dip into the gap zone (91,800–93,400) to fill the imbalance.
We have a entry around the lower part of the gap ($91,800–$92,200).
Stop loss: Below $91,500 to invalidate the setup.
After the gap fill, we can expected strong bullish continuation
Entry: 91600
TP1: 92800
TP2: 93500
TP3: 94500
SL Below 90500
Like and support for more ideas.
Cheers
GreenCrypto

BTC OUTLOOKDo what you want with this information, but in my opinion, both NQ and BTC are likely to dip soon. Just my take.

Bitcoin call from March comes into fruition, Almost to the day!Not looking to toot horn but, did we state anything about buying CRYPTOCAP:BTC or CRYPTOCAP:ETH until recently? NO! (pls see our profile for more info on that)
We have been analyzing Bitcoin & Ethereum and posting suggestions. But until recently we did not state any buy recommendations.
In fact, om March 25th we stated that there would be a big move coming by mid April!
We then changed our stance on #Bitcoin. We noticed, far to frequent anomaly using
@tradingview charts, trendlines MOVE on their own, that the move COULD be until the 8th of May! HOWEVER, less than 2 weeks ago, we stated that A MOVE was coming before then. It has happened almost to the T!!!

BTC longBTC D chart looks ready for a move up.
rsi ⬆️☑️
down trend line broken ☑️
volume increase ☑️
Behind the Curtain: Bitcoin’s Surprising Macro Triggers1. Introduction
Bitcoin Futures (BTC), once viewed as a niche or speculative product, have now entered the macroeconomic spotlight. Traded on the CME and embraced by institutions through ETF exposure, BTC Futures reflect not only digital asset sentiment—but also evolving reactions to traditional economic forces.
While many traders still associate Bitcoin with crypto-native catalysts, machine learning reveals a different story. Today, BTC responds dynamically to macro indicators like Treasury yields, labor data, and liquidity trends.
In this article, we apply a Random Forest Regressor to historical data to uncover the top economic signals impacting Bitcoin Futures returns across daily, weekly, and monthly timeframes—some of which may surprise even seasoned macro traders.
2. Understanding Bitcoin Futures Contracts
Bitcoin Futures provide institutional-grade access to BTC price movements—with efficient clearing and capital flexibility.
o Standard BTC Futures (BTC):
Tick Size: $5 per tick = $25 per tick per contract
Initial Margin: ≈ $102,000 (subject to volatility)
o Micro Bitcoin Futures (MBT):
Contract Size: 1/50th the BTC size
Tick Size: $5 = $0.50 per tick per contract
Initial Margin: ≈ $2,000
BTC and MBT trade nearly 24 hours per day, five days a week, offering deep liquidity and expanding participation across hedge funds, asset managers, and active retail traders.
3. Daily Timeframe: Short-Term Macro Sensitivity
Bitcoin’s volatility makes it highly reactive to daily data surprises, especially those affecting liquidity and rates.
Velocity of Money (M2): This lesser-watched indicator captures how quickly money circulates. Rising velocity can signal renewed risk-taking, often leading to short-term BTC movements. A declining M2 velocity implies tightening conditions, potentially pressuring BTC as risk appetite contracts.
10-Year Treasury Yield: One of the most sensitive intraday indicators for BTC. Yield spikes make holding non-yielding assets like Bitcoin potentially less attractive. Declining yields could signal easing financial conditions, inviting capital back into crypto.
Labor Force Participation Rate: While not a headline number, sudden shifts in labor force data can affect consumer confidence and policy tone—especially if they suggest a weakening economy. Bitcoin could react positively when data implies future easing.
4. Weekly Timeframe: Labor-Driven Market Reactions
As BTC increasingly correlates with traditional markets, weekly economic data—especially related to labor—has become a mid-term directional driver.
Initial Jobless Claims: Spikes in this metric can indicate rising economic stress. BTC could react defensively to rising claims, but may rally on drops, especially when seen as signs of stability returning.
ISM Manufacturing Employment: This metric reflects hiring strength in the manufacturing sector. Slowing employment growth here could correlate with broader economic softening—something BTC traders can track as part of their risk sentiment gauge.
Continuing Jobless Claims: Tracks the persistence of unemployment. Sustained increases can shake risk markets and pull BTC lower, while ongoing declines suggest an improving outlook, which could help BTC resume upward movement.
5. Monthly Timeframe: Macro Structural Themes
Institutional positioning in Bitcoin increasingly aligns with high-impact monthly data. These indicators help shape longer-term views on liquidity, rate policy, and capital allocation:
Unemployment Rate: A rising unemployment rate could shift market expectations toward a more accommodative monetary policy. Bitcoin, often viewed as a hedge against fiat debasement and monetary easing, can benefit from this shift. In contrast, a low and steady unemployment rate may pressure BTC as it reinforces the case for higher interest rates.
10-Year Treasury Yield (again): On a monthly basis, this repeats and become a cornerstone macro theme.
Initial Jobless Claims (again): Rather than individual weekly prints, the broader trend reveals structural shifts in the labor market.
6. Style-Based Strategy Insights
Bitcoin traders often span a wide range of styles—from short-term volatility hunters to long-duration macro allocators. Aligning indicator focus by style is essential:
o Day Traders
Zero in on M2 velocity and 10-Year Yield to time intraday reversals or continuation setups.
Quick pivots in bond yields or liquidity metrics could coincide with BTC spikes.
o Swing Traders
Use Initial Jobless Claims and ISM Employment trends to track momentum for 3–10 day moves.
Weekly data may help catch directional shifts before they appear in price charts.
o Position Traders
Monitor macro structure via Unemployment Rate, 10Y Yield, and Initial Claims.
These traders align portfolios based on broader economic trends, often holding exposure through cycles.
7. Risk Management Commentary
Bitcoin Futures demand tactical risk management:
Use Micro BTC Contracts (MBT) to scale in or out of trades precisely.
Expect volatility around macro data releases—set wider stops with volatility-adjusted sizing.
Avoid over-positioning near major Fed meetings, CPI prints, or labor reports.
Unlike legacy markets, BTC can make multi-percent intraday moves. A robust risk plan isn’t optional—it’s survival.
8. Conclusion
Bitcoin has matured into a macro-responsive asset. What once moved on hype now responds to the pulse of the global economy. From M2 liquidity flows and interest rate expectations, to labor market stability, BTC Futures reflect institutional sentiment shaped by data.
BTC’s role in the modern portfolio is still evolving. But one thing is clear: macro matters. And those who understand which indicators truly move Bitcoin can trade with more confidence and precision.
Stay tuned for the next edition of the "Behind the Curtain" series as we decode the economic machinery behind another CME futures product.
When charting futures, the data provided could be delayed. Traders working with the ticker symbols discussed in this idea may prefer to use CME Group real-time data plan on TradingView: www.tradingview.com - This consideration is particularly important for shorter-term traders, whereas it may be less critical for those focused on longer-term trading strategies.
General Disclaimer:
The trade ideas presented herein are solely for illustrative purposes forming a part of a case study intended to demonstrate key principles in risk management within the context of the specific market scenarios discussed. These ideas are not to be interpreted as investment recommendations or financial advice. They do not endorse or promote any specific trading strategies, financial products, or services. The information provided is based on data believed to be reliable; however, its accuracy or completeness cannot be guaranteed. Trading in financial markets involves risks, including the potential loss of principal. Each individual should conduct their own research and consult with professional financial advisors before making any investment decisions. The author or publisher of this content bears no responsibility for any actions taken based on the information provided or for any resultant financial or other losses.

BCT CMEWe are have 2 target
1) 86850
2) 83200
Friday close in 4h sibi, I think this Sunday NWOG open price down and looking stops lvl 83.200
We are see below 4h bisi after week vi, I think price need move first this area for create sales candle and after hunt 86.850 above NWOG 7 March
I search buy in this two pd area
Lets see what happen after open exchanges

Bitcoin's Safe-Haven Ascent: Could BTC Join Gold As the US dollar teeters on long-term support, yields flash warnings, and USD/JPY unravels, Bitcoin's structure points to a reversal—and a potential role alongside gold as a global safe-haven asset.
Bitcoin and Gold: The New Twin Pillars of Safety?
A profound shift may be underway in how investors, institutions, and even governments perceive Bitcoin. Traditionally viewed as a high-beta, speculative asset, Bitcoin now displays characteristics of a safe-haven, particularly as macroeconomic cracks widen across currencies and sovereign bonds. The timing of this shift aligns with a historic divergence in key legacy instruments—including the USD/JPY, US Dollar Index (DXY), and the 10-Year Treasury Yield.
Most notably, Bitcoin's price structure has begun to mimic the strategic behaviour of gold—establishing support in times of uncertainty and attracting institutional flows amid fiscal and monetary instability. This raises a crucial question: Is Bitcoin on the verge of joining gold as a global safe-haven asset?
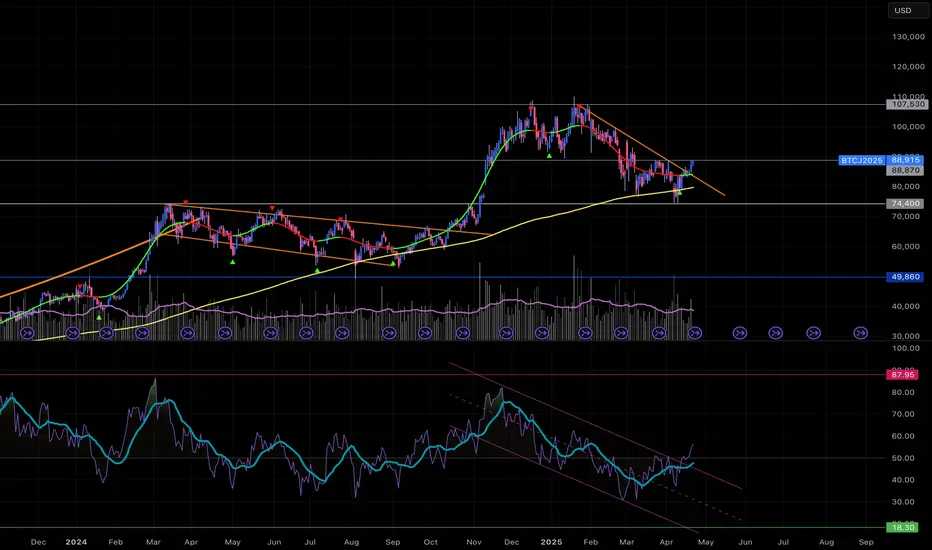
Bitcoin Futures Technical Outlook: Falling Wedge with Macro Fuel
Bitcoin Futures have retraced sharply from the January 2025 high of $110,150, establishing a double-bottom support zone at $75,255. This level has been tested twice, forming the base of a falling wedge pattern—a historically bullish formation that often leads to explosive trend reversals.
At the time of writing, BTC trades at $85,725, just below the critical resistance of $86,210. A confirmed breakout above this level could trigger a reversal to the upside, with targets at $94,580 and $102,950 and eventually a retest of the yearly high.
This technical setup is not occurring in isolation—it coincides with widespread fragility in the fiat financial system, prompting institutional investors to reconsider their allocation frameworks.
Institutional Rotation: The Rise of Bitcoin ETFs and Safe-Haven Utility
Several recent developments support the view that Bitcoin is evolving into a macro hedge:
BlackRock, Fidelity, Franklin Templeton, and others have launched US-regulated Bitcoin spot ETFs, marking a major milestone in institutional validation.
MicroStrategy added 6,911 BTC to its balance sheet in March 2025, increasing total holdings to over 214,000 BTC—an institutional vote of confidence.
Global de-dollarization trends are accelerating. Central banks are accumulating gold, while sovereign wealth funds and hedge funds are experimenting with BTC allocations as fiat uncertainty grows.
There is a noticeable behavioural shift in how public and private entities are positioning around Bitcoin—as a hedge, a reserve diversification play, and a long-term insurance policy against fiat failure.
Conclusion: Bitcoin and Gold—Digital and Physical Reserves in a Changing World
Gold and Bitcoin are increasingly being viewed not as competitors but as complementary tools in future portfolio construction.
As legacy systems show signs of strain:
-USD/JPY is breaking long-term support
-DXY is teetering at cycle lows
-10YR yields are rolling over structurally
Bitcoin is diverging upward, carving a path that suggests more than just a short-term trade. The price structure, macro alignment, and institutional behaviour are signalling a fundamental transformation.
In the next five years, we may not just see Bitcoin as a digital asset—but as a strategic safe-haven asset class alongside gold—a modern counterpart to the oldest reserve in history.

$BTC LONG BTCCRYPTOCAP:BTC
Position update on the current market structure.
The block was tested from above, but there was no full-fledged move in - a sign of limited pressure from the seller so far. That said, there remains the possibility of liquidity taking hold in the $82,000-$83,000 range. The key condition is the realization of the scenario within the next week, maximum - before the month's close.
May, in the absence of extraordinary events from the political agenda (primarily the US and Trump), should work out in positive dynamics.
If the market ignores the designated range and forms a break above $90,000 before the end of April - the scenario with a re-entry under $80,000 becomes extremely unlikely.
Simply put, the current volatility and fluctuations are just localized structural distortions within the dominant bullish medium-term trend. Going above $90,000 in this configuration becomes the base scenario, the only question is the nature of short-term price transformation.

CME Gap Filled for the weekNo other gaps Available on the downside. Gap filled for the week
Only one Gap remaining that is in 100k area
