Lingrid | HYPEUSDT Potential Continuation After PullbackKUCOIN:HYPEUSDT is bouncing from a higher low near the 42.070 zone after breaking a descending flag pattern. Price action remains above the ascending support trendline while pressing into a key structure retest. As long as GETTEX:HYPE stays above 42, a bullish leg toward the 49.700 resistance remains likely. Structure suggests a resumption of the impulse phase within the broader uptrend.
📉 Key Levels
Buy trigger: Clean breakout above 45.00
Buy zone: 41.5 – 43.0 (support + flag bottom)
Target: 49.700
Invalidation: Close below 40.00
💡 Risks
Breakdown below the ascending support would weaken the bullish setup
Failure to reclaim mid-flag resistance may lead to deeper consolidation
Broader market weakness in altcoins could delay breakout momentum
If this idea resonates with you or you have your own opinion, traders, hit the comments. I’m excited to read your thoughts!
HYPEUSDT trade ideas

Hypecoin short to $41.139Just now opened up a short position on hypecoin. Aiming for new lows around $41.139
Price is high on weekly tf and seems to be in a correction phase of the market. Lower tf likely to dump down to facilitate this.
Sl: $44.665
Tp1: $42.061
tp2: $41.139

Hypecoin weekend short to $35.75hypeusdt short
Sl: $36.72-38.85
Tp1: $36.34---50%
Full Exit: $35.75
2.21-3 RR
DTT strategy applied
Time sensitive

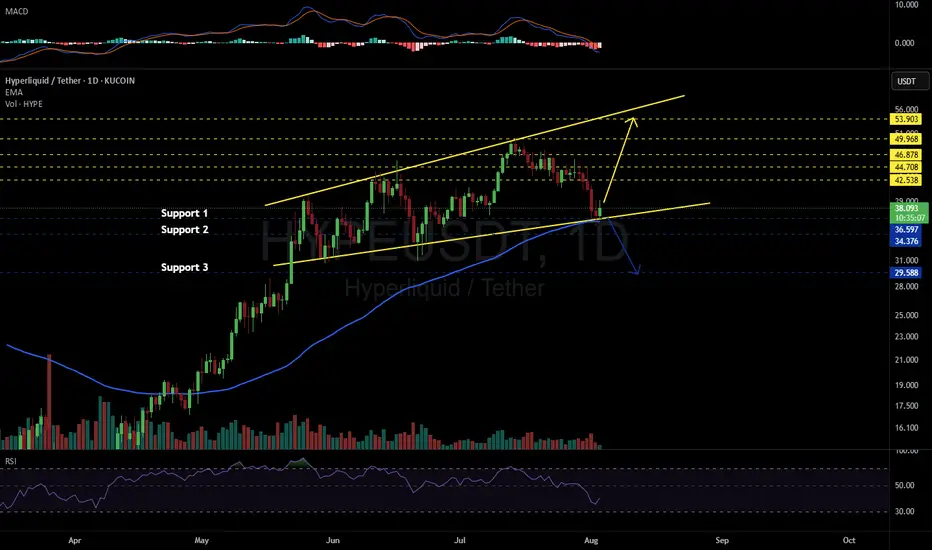
HYPEUSDT 1D#HYPE is moving inside an Ascending Broadening Wedge pattern on the daily chart — a structure that typically carries a bearish bias.
However, for now, #HYPE has bounced from the wedge support line and the daily EMA100, suggesting a possible short-term move to the upside.
If momentum continues, potential targets are:
🎯 $42.538
🎯 $44.708
🎯 $46.878
🎯 $49.968
🎯 $53.903
📉 On the other hand, if price breaks below the pattern, the daily EMA100, and the $36.597 support, deeper correction could follow toward:
🔻 $34.376
🔻 $29.588
⚠️ As always, use a tight stop-loss and apply proper risk management.
Long Hype, Looking for a retracement, we have double bottoms and double tops and then see London and NY trade to Sunday high.

HYPE - a major correction can be expected One of the most interesting tokens of the HYPE cycle. It initially fell to zero, then rebounded and began to set new all-time highs one after another. During corrections, it even outperformed Bitcoin.
But all good things come to an end sooner or later, and for HYPE, the time has probably come to cool down, and here's why:
➡️ HYPE broke its ascending flag pattern for the first time in four months, signaling a potential trend reversal.
➡️ Throughout the last month, HYPE's growth has been accompanied by a divergence in purchase volumes, indicating declining interest from buyers.
➡️ Money Flow, although in harmony with the scene, began a major fix of positions at the last ATH of $51, and in just a couple of days, the indicator fell into negative territory. Potentially breaking through its sloping support.
➡️ The main areas of interest are at the top, apparently attracting limit orders for shorts. And the first major support level has already been broken at $40.
➡️ The next major support is at $30, where we can expect an upward rebound.
📌 Conclusion:
HYPE has been growing for a very long time, against all odds, against the entire market. And the moment had to come when profit-taking would begin. $50 is a major psychological level, and liquidity has begun to leak out noticeably.
So perhaps this stage is already upon us. But I would not rush to look for buying opportunities, even on the spot. The token is very young, and we do not yet know its real price; it has been both $50 and $9. It is worth giving it time to trade so that we can find out its fair price over time.
Good health and big profits to all! 🔥

HYPE/USDT: "A++" Long Setup - A Perfect Storm of ConfluenceHello traders,
This analysis covers what I consider to be an "A++" high-probability long setup on HYPE/USDT, viewed on the 9H timeframe. It is rare to see this many powerful technical factors align at once, signaling a potential major bottom and the start of a new bullish leg.
1. Trend & Context (The "Why")
The price has pulled back into a critical zone where a confluence of price, time, and momentum indicators are all screaming bullish.
Here is the checklist of the extraordinary confluences:
1. Price Action (LSOB Demand): The primary signal comes from price action. The price has entered a major Bullish LSOB (Liquidity Sweep Order Block) on the 9H chart. This is a critical institutional demand zone where we expect strong buying interest.
2. Time-Based Confluence (Fibonacci Cycle): This is a unique and powerful confirmation. The potential reversal is occurring precisely on a 144 Fibonacci Time Cycle line. When a key price level aligns with a major time cycle, the probability of a significant market turning point increases dramatically.
3. Dynamic Support : The LSOB zone is also confluent with the EMA 200, adding another layer of strong dynamic support to this area.
4. Momentum Exhaustion (MC Orderflow): The momentum oscillator provides the final, undeniable confirmation:
The MC Orderflow itself is in the OVERSOLD zone on this 9H timeframe.
THE CRITICAL CONFLUENCE: The Multi-Timeframe Cycle Table shows that the 4H and Daily timeframes are BOTH "Oversold". This trifecta of oversold signals (4H, 9H, and Daily) is the highest level of momentum confirmation we can get.
2. Entry, Stop Loss, and Targets (The "How")
This powerful alignment provides a very clear trade plan with an exceptional risk-to-reward ratio.
Entry: An entry at the current price level ($38.50 - $39.30) is ideal, as it is directly within the LSOB demand zone.
Stop Loss (SL): $37.50. This places the stop loss safely below the entire LSOB zone and the recent swing low. A break below this level would invalidate this entire bullish structure.
Take Profit (TP) Targets:
TP1: $42.50 (Targeting the cluster of short-term EMAs, which will act as the first resistance).
TP2: $45.00 (The bottom of the Bearish LSOB supply zone, a major magnet for price).
TP3: $49.90 (The major swing high of the range, for a full trend continuation).
Conclusion
This is one of the highest-quality setups I've seen. The perfect alignment of a key price level (LSOB), a major time cycle (Fib 144), and multi-timeframe momentum exhaustion (4H & Daily Oversold) creates a textbook, high-conviction environment for a significant bullish move.
Disclaimer: This is not financial advice. This analysis is for educational purposes only. Always conduct your own research and manage your risk appropriately.

Is $Hype worth the hype?Ascending Channel:
- The price has been moving inside a rising (bullish) channel since mid-April 2025.
- If this channel holds as support, the price may bounce upward again, continuing the uptrend.
- If it breaks below the channel, this could signal a trend reversal or deeper correction.
Tips
- Trend followers may look to buy on dips near the lower channel line.
- Breakout traders should watch for moves outside the lower channel line.

HYPE/USDT Is moving sideways in a tight consolidation rangeHYPE/USDT is moving sideways in a tight consolidation range between $41.00–$45.90. Moderate whale activity is evident from on-chain data, alongside ecosystem factors like TVL at ~$800M and a 54% fee revenue allocation program, but broader market sentiment (e.g., Bitcoin correlation) adds caution.
Key points with real chart zones:
The recent pullback was likely a "liquidity sweep": Price dropped to test ~$41.00-$41.05 support levels, triggering liquidations and enabling accumulation at lower prices, though this is common in volatile markets.
Bounce and consolidation: After the low, price reclaimed ~$42.00-$43.00, showing buyer interest, but volume remains flat, suggesting potential for either direction without strong conviction.
Ascending channel structure remains intact: The 1D ascending channel holds if price stays above $39.00-$40.20 (lower boundary, golden pocket) and below $46.00-$48.00 (upper boundary). Additional indicators: RSI at neutral 50 (no divergence yet), and OBV trending flat—watch for shifts.
If price breaks above the range: A confirmed H1/H4 close above $45.90 with rising volume could target $48.00 and $50.00-$52.00, but only if BTC holds above $65K (high correlation risk).
If price breaks down and holds below: Action below $41.00 may test $39.00-$40.20, with extension to $37.20-$38.00 if supports fail—amplified by macro factors like upcoming Fed decisions.
Bottom line: HYPE is in a neutral consolidation zone between $41.00–$45.90. Upside to $48.00+ possible with confirmation, but downside to $39.00 equally likely amid flat indicators and external risks. On-chain favors mild positivity, but balance with stops and macro monitoring—ranges can fake out in either direction.
Tip: Avoid chasing moves without confirmation. Set alerts at $45.90 (upside) and $41.00 (downside), track RSI for divergences, volume for accumulation, and news like Fed updates or BTC trends. Position size small (<2% portfolio)—trade safely and always do your own research!
This is not financial advice!

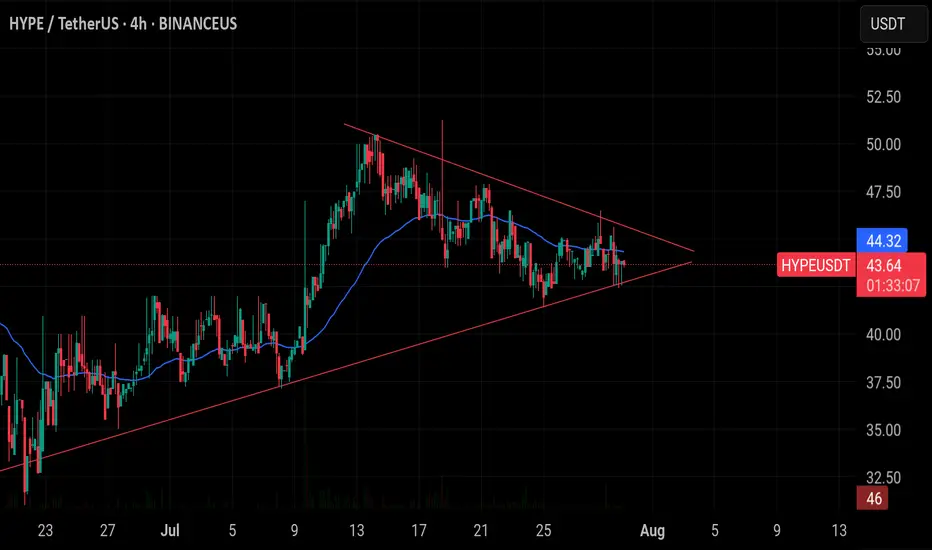
HYPEUSDT Potential Continuation After Pullback
HYPEUSDT
is bouncing from a higher low near the 42.070 zone after breaking a descending flag pattern. Price action remains above the ascending support trendline while pressing into a key structure retest. As long as
HYPE
stays above 42, a bullish leg toward the 49.700 resistance remains likely. Structure suggests a resumption of the impulse phase within the broader uptrend.
📉 Key Levels
Buy trigger: Clean breakout above 45.00
Buy zone: 41.5 – 43.0 (support + flag bottom)
Target: 49.700
Invalidation: Close below 40.00

Hyperliquid (HYPE): 200EMA Has Been Holding Trend Very WellHYPE has been respecting that 200 EMA on the 4-hour timeframe pretty well, and once again we have fallen back to that EMA.
We are looking for some kind of BOS on smaller timeframes, which would give us a good buying opportunity and potentially form a new local high on the current timeframe.
Swallow Academy

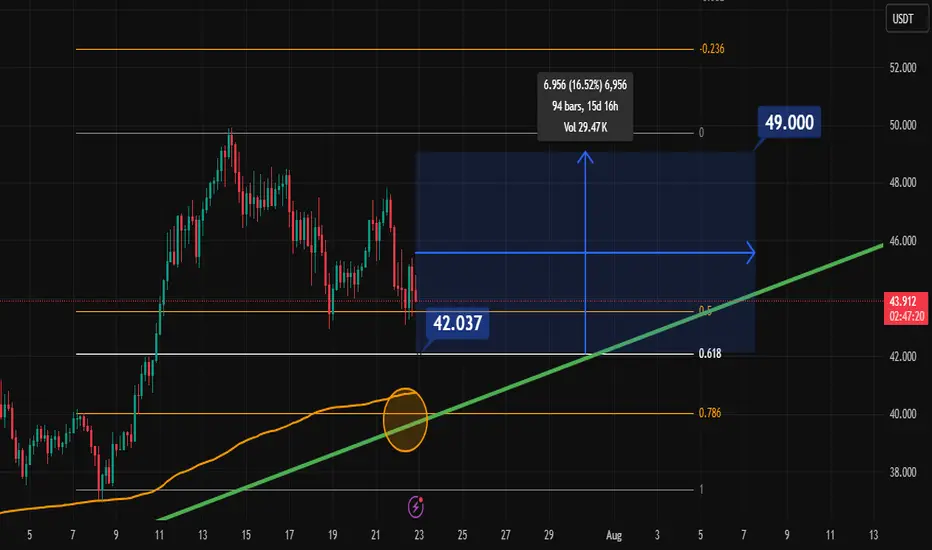
Does Hype Pump from 42 to 49 before August?Well, I have my SPOT chips on that.
I wanna hold on to that in the next 15 days. That is Untill 7th August.
HYPE Swing Long Opportunity - Altcoin Season📌 Fundamental Sentiment:
The crypto market — alongside broader risk assets — continues to gain traction. This momentum is largely fueled by rising expectations of policy shifts in the U.S., with Trump intensifying pressure on Jerome Powell and advocating for aggressive rate cuts from the Fed.
📌 Technical Analysis:
HYPE is approaching a key HTF bullish trendline, and confluences are stacking up in the same region:
✅ HTF Demand Zone
✅ Equilibrium (EQ) of the HTF bullish trend
✅ Bullish Trendline Support
These three HTF confluences overlapping at the same price zone indicate a high-probability setup for a significant bounce and a possible swing long opportunity.
📌 Gameplan:
Price hits HTF bullish trendline
HTF demand zone gets tested
EQ level tapped → discount offered to buyers
📌 LTF Confirmation Criteria:
I’ll wait for:
A 1H swing break
A strong 4H rejection candle
These will confirm momentum shift. If confirmed, I’ll enter a swing long.
🎯 Target: $60
💰 Potential gain: ~+50%
❗ Stop-loss: Below the swing low that triggers the LTF confirmation
—
🔔 Follow for daily setups and weekly macro recaps
💬 Drop your chart or questions below!

Hyperliquid is retesting the $44 level ┆ HolderStatKUCOIN:HYPEUSDT has flipped $0.074 into support. Holding this level could trigger a move to $0.088. Structure favors bulls.
Watch Hyperliquid Surge 18% to $46 Key Resistance LevelHello,✌
let’s dive into a full analysis of the upcoming price potential for Hyperliquid 🔍📈.
KUCOIN:HYPEUSDT is trading within a reliable daily ascending channel and is currently near its lower boundary, where a strong daily support zone has formed. This setup suggests a potential upside of at least 18%, with a target around $46 , which aligns closely with a key trendline. 📈
✨ Need a little love!
We pour love into every post your support keeps us inspired! 💛 Don’t be shy, we’d love to hear from you on comments. Big thanks , Mad Whale 🐋

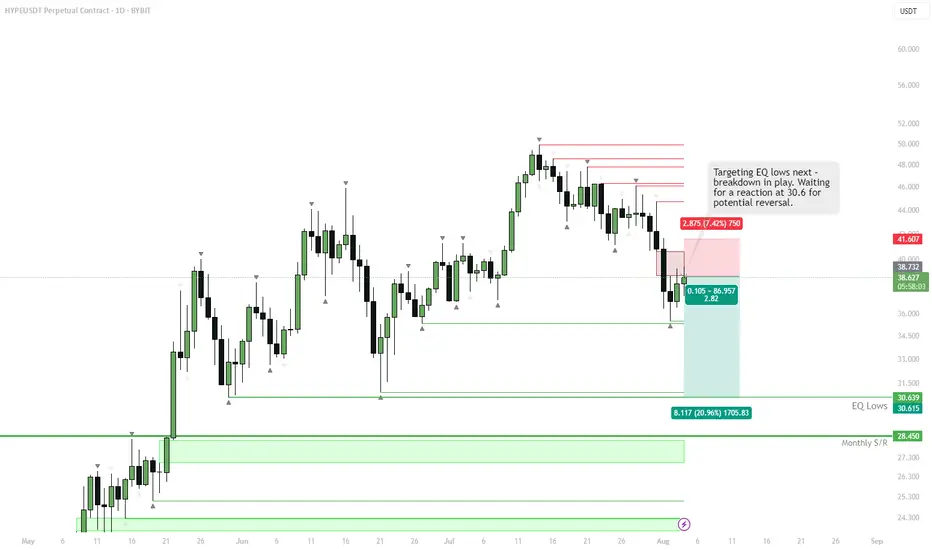
HYPE – EQ lows next Local breakdown confirmed after losing support, with no clear reversal signal yet. Structure favors a continued move lower toward the equal lows around 30.64. Momentum is still to the downside, so no reason to anticipate a bounce early.
Plan:
• Main target: EQ lows zone (~30.64)
• If monthly S/R at 28.45 doesn’t hold, further downside opens up
• No long setups until a reaction and reclaim of a key support
Hyperliquid held the support at $36 ┆ HolderStatOKX:HYPEUSDT.P has pulled back to a critical support zone near $36.00 while staying inside a falling channel. Previous triangle and sideways zones preceded major breakouts, and the current setup could be a repeat. A breakout above $40.00 would shift structure bullish again.

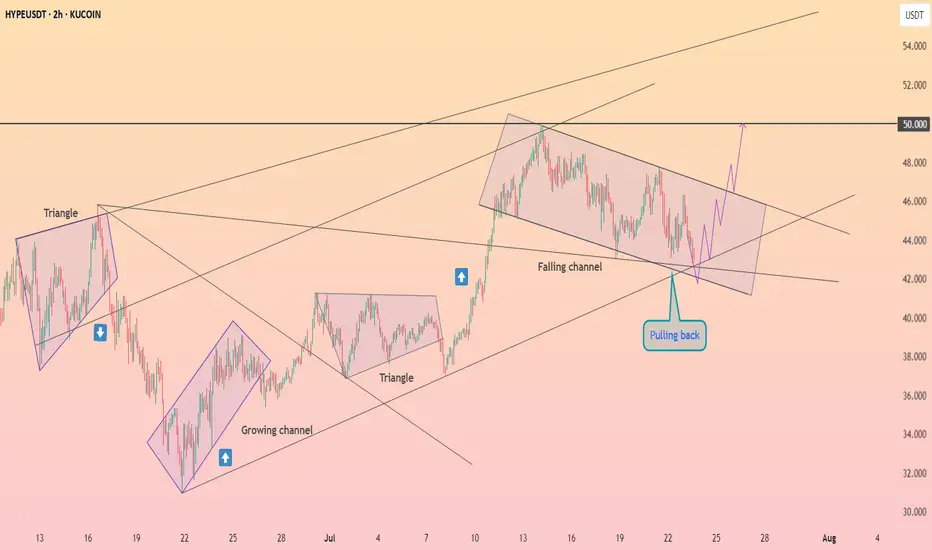
HYPE - Imbalance to be filledVery nice imbalance on HYPE here, I think there are a few different things to keep an eye on, money to be made for sure.
Technically an msb on H1, although again a strong rejection and only a very short time spent above the msb. But we can try a long on the retest in the green box, if we get it. Stop is below the low.
Second long attempt is enter where we just got stopped, but only on a reclaim OR look for ltf entry in the big green box below.
Both tps are in the imbalance shown on the chart, from where we can eye rejection for trend continuation down.
HYPEUSDT at Support HYPEUSD is trading in a symmetrical triangle and price has now reached the support trendline the price may reverse from here to reach the upper trendline resistance .
Hyperliquid reached the upper limit of the wedge ┆ HolderStat$BINANCE:HYPEUSDT is currently trading within a falling wedge after a sharp bullish move. Price is consolidating near key support around 41.2, showing signs of pressure building for a potential breakout. A clean break above the wedge resistance may open the path toward 49.5, aligning with the higher trend channel projection.
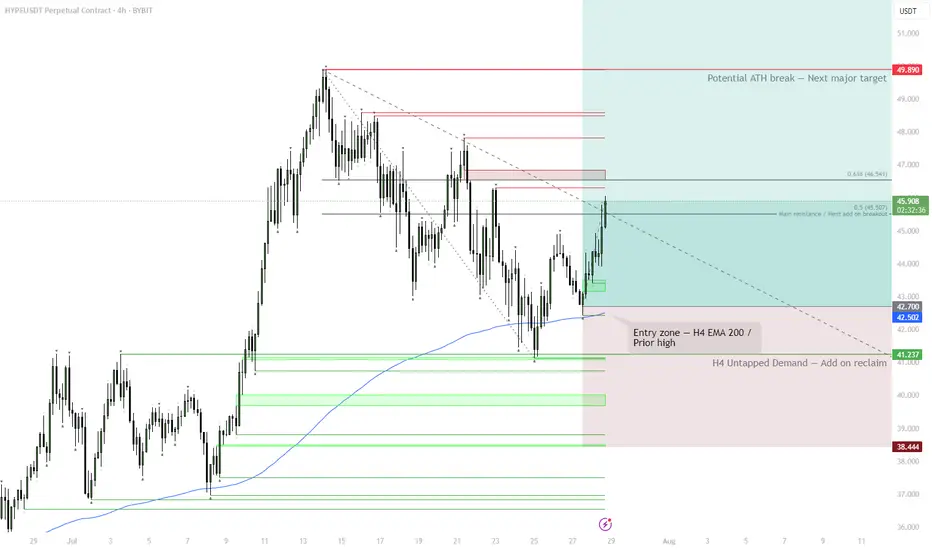
HYPE | Sweep & Reclaim SetupPlan:
Watching for a sweep into the blue H4 Untapped Demand zone, then a reclaim of 41.237 (green line) to add longs.
Ideal target: new ATH and 55 extension.
If the blue zone fails or we can't reclaim 41.237, risk-off mode: equal lows at 30.6 could be the draw.
Reasoning:
A sweep into demand would reset local liquidity and trap late shorts.
Reclaiming 41.237 confirms a shift in momentum and invalidates the breakdown.
Structure is bullish above 41.237; below, risk increases for deeper downside.

$HYPE/USDT is sitting at the edge of a triangle.$HYPE/USDT is sitting at the edge of a triangle. If it breaks above $44, it could jump to $52. But if it falls and close 4h candle below $42, the setup will fail.
HYPE | #12h #long — Major Reversal Setup from 200 EMA & DemandStarted building a position around 42.7 due to the under/over of the H4 EMA 200 and the prior consolidation high. However, there's an untapped H4 demand zone beneath — if we get a flush into that area and then reclaim 41.2 and the H4 EMA 200, I'll be adding to my position.
Invalidation:
Losing the H4 demand would be my cut-off, potentially opening the door for a sweep of the equal lows near 30.
Scenario:
— If the 200 EMA holds or we see #OneMoreLow to trap sellers and reclaim, the setup remains very bullish.
— Targets: At minimum, a stab into ATH, with the potential for a full extension up to 55.3 and beyond.
Reasoning:
This is a classic under/over setup with demand untested and a clear invalidation level. If buyers step in and reclaim key levels, expect explosive continuation.