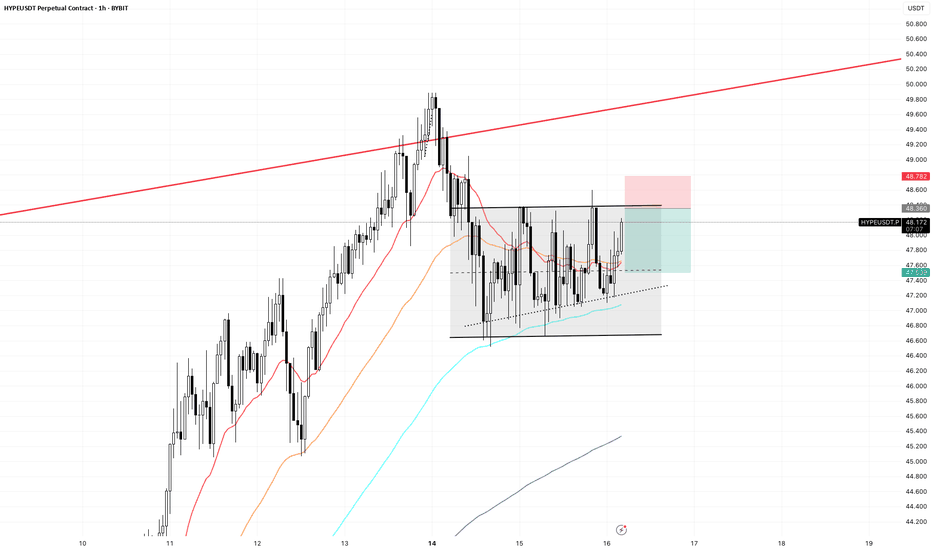
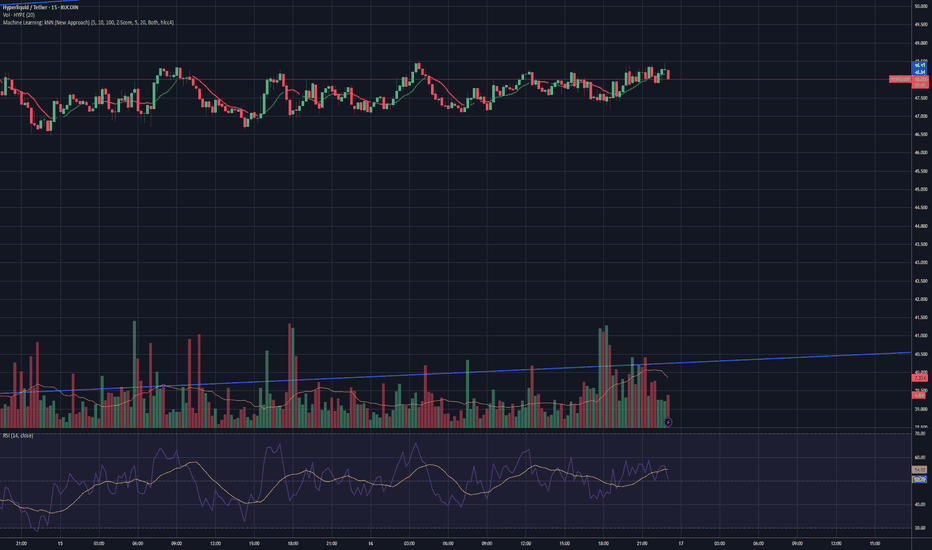
Lingrid | HYPEUSDT Trend Continuation Pattern ConfirmedThe price perfectly fulfilled my last idea . KUCOIN:HYPEUSDT has respected the higher low structure and bounced from the lower bound of its upward channel. After a corrective move and consolidation above the $38.80 level, the asset has formed a trend continuation pattern. With bullish structure still intact, price is gearing for a breakout toward the $48.00 resistance area. Continuation within the channel keeps the upside scenario valid.
📈 Key Levels
Buy zone: $38.80 support with bounce confirmation
Buy trigger: breakout above trend continuation structure
Target: $48.00 major resistance and top of ascending channel
Invalid level: sustained close below $38.80 risks invalidation of bullish bias
💡 Risks
Loss of channel support would trigger bearish momentum
Volatility near resistance levels may cause fakeouts
Macro shifts in sentiment could delay the breakout pattern
If this idea resonates with you or you have your own opinion, traders, hit the comments. I’m excited to read your thoughts!
HYPEUSDT trade ideas
Real party starts when hype breaks out against btc pair Any meaningful crypto looking to enter top 10 territory will understandably be under the scope of some major btc whales . Since crypto assets for size buyers are carefully paired up against btc . The hype/btc chart should be the one that would catapult us into price discovery once we break agints btc. I anticipate large buyers to enter this trade
Hype - Resistance Levels to HigherCurrently you are looking at a rising wedge retest on Hype I
It will now either
1) Reject Here
2) Attempt to avoid having to go the full short target by pumping back up through the wedge.
Main Resistance Points coming up that makes be think we see a wick and through, failure to flip the wedge and back down lower
Daily Resistance / Fib Pivot Points
(Labeled On The Chart)
R3 / R2 / R1 / PP S1/S2/S3
$53.66 / $47.96 / $44.45 / $38.7 / $33.03 / $29.55 / $23.86
Fib 1.6 April Swing Low (TOP TOP) is $59 which likely is explored later t
Watch Hyperliquid Surge 18% to $46 Key Resistance LevelHello,✌
let’s dive into a full analysis of the upcoming price potential for Hyperliquid 🔍📈.
KUCOIN:HYPEUSDT is trading within a reliable daily ascending channel and is currently near its lower boundary, where a strong daily support zone has formed. This setup suggests a potential upside of at least 18%, with a target around $46 , which aligns closely with a key trendline. 📈
✨ Need a little love!
We pour love into every post your support keeps us inspired! 💛 Don’t be shy, we’d love to hear from you on comments. Big thanks , Mad Whale 🐋
HYPE/USDT -3 digit HYPE is currently ranked among the top 11 cryptocurrencies, backed by a fundamentally strong project with a highly credible team behind it. Market sentiment and investor interest are rising rapidly, and the long-term potential is undeniable.
Price has successfully reclaimed the $42 level, which previously acted as a major resistance zone. This breakout signals the beginning of a potential macro uptrend.
Given the current structure and momentum, we are targeting a three-digit price zone as a medium to long-term setup — a move that aligns with both technical structure and fundamental strength.
DeGRAM | HYPEUSD formed the triangle📊 Technical Analysis
● Price is coiling inside a fresh symmetrical triangle perched on the rising-channel mid-band (38.3 USDT); higher lows since 30 Jun show demand absorbing offers at support.
● A triangle breakout above 40.0 would reopen the run to the channel roof / June high at 43.8, while channel base is climbing through 36.0—creating a favourable risk-to-reward floor.
💡 Fundamental Analysis
● KuCoin’s 8 Jul launch of HYPE perpetuals and news of a GameFi partnership with Immutable X lifted spot volume 40 % w-w, hinting at fresh speculative inflows.
✨ Summary
Buy 38.0–39.0; sustained bid over 40.0 targets 43.8. Invalidate on a 4 h close below 36.0.
-------------------
Share your opinion in the comments and support the idea with a like. Thanks for your support!
HYPE Swing Long – 5.2R Setup on Fib PullbackI’m planning to enter a HYPE swing long on a golden pocket pullback during a bullish structure continuation, with confluence from EMAs, fibs, and demand volume. The setup is based on the daily chart for trend structure and 1-hour chart for entry timing.
My stop is placed below structural invalidation, and I have two profit targets: one conservative (TP1) and one trend-continuation (TP2). I plan to move my stop to breakeven after TP1 is hit in order to protect the trade and let the rest run risk-free.
Entry at $39.20 – Inside the golden pocket (0.618–0.786 fib), where bullish pullbacks often reverse. Confluence with 21 and 50 EMA on the daily and high-volume support just below.
Stop-loss at $37.80 – Below structure and golden pocket. If broken, the setup is invalid and trend may shift.
TP1 at $43.00 – Previous local high and supply zone. Strong resistance and logical partial profit zone. Locks in ~2.7R. I plan to secure partial profits here and move my stop to breakeven.
TP2 at $46.50 – Full fib extension and psychological resistance. If trend continues, this is where momentum likely tops out short term. Gives ~5.2R.
hyperhypeTechnical analysis of HYPE/USDT. The chart shows a prolonged sideways range after an impulse move, with regular volume spikes that don’t lead to continuation—likely the work of algorithmic trading or a market maker.
My questions: How can you distinguish between accumulation and distribution by a large player? When should we expect the start of a new trend?
Looking forward to opinions from experienced traders.
HolderStat┆HYPEUSD has consolidated above the trend line$OKX:HYPEUSDT surged after a breakout from a well-formed triangle and a bullish retest of prior resistance. The chart shows a textbook ascending channel with the price climbing from $38 toward the $56 upper range. If momentum remains, a breakout beyond the top boundary is likely.
HYPEUSDT KUCOIN:HYPEUSDT 4H Analysis Price has broken out above the 44.5 support zone and is holding strong 🚀. As long as this level holds, targets are set at 50.615 and 57.164 📈. If 44.5 breaks down, next support is seen at 40.433 🔻.
Key Levels:
✅ Support: 44.5
🟩 Targets: 50.615 → 57.164
🔴 Next support if breakdown: 40.433
$HYPE - Short-term OutlookKUCOIN:HYPEUSDT | 8h
We're seeing a short-term distribution forming on the daily chart.
Price has now tested the supply zone around $42 three times and is struggling to break through.
There's local demand in the $34.5–$34 area, where I expect a reaction, in confluent with vwap. However, if price keeps getting rejected at $37–38, a move back to $30 is likely.
A break below $30 opens the door for a deeper drop toward $27–24, which is a higher timeframe demand zone.
HYPEUSDT Probably CookedToken driven by demand from trading on Hyperliquid. Crypto looks set for a few month long consolidation probably into Q4.
That loss in trading volume will reduce demand for the token and the company may be forced to sell the token to come up with large gains for its clients. Either way it's a bearish catalyst for the token which has really ran hard. Ugly head and shoulders as well as a topping pattern in an overall financial market that looks like it wants a pull back


