HYPEUSDT trade ideas
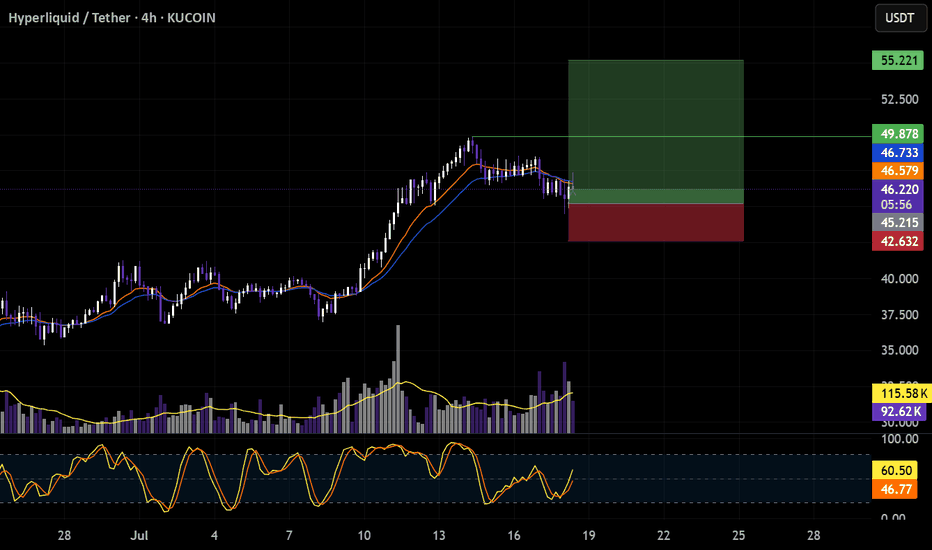
HYPE | #12h #long — Major Reversal Setup from 200 EMA & DemandStarted building a position around 42.7 due to the under/over of the H4 EMA 200 and the prior consolidation high. However, there's an untapped H4 demand zone beneath — if we get a flush into that area and then reclaim 41.2 and the H4 EMA 200, I'll be adding to my position.
Invalidation:
Losing the H4 demand would be my cut-off, potentially opening the door for a sweep of the equal lows near 30.
Scenario:
— If the 200 EMA holds or we see #OneMoreLow to trap sellers and reclaim, the setup remains very bullish.
— Targets: At minimum, a stab into ATH, with the potential for a full extension up to 55.3 and beyond.
Reasoning:
This is a classic under/over setup with demand untested and a clear invalidation level. If buyers step in and reclaim key levels, expect explosive continuation.
Hyperliquid (HYPE): Good Buying Opportunity or Great Dump ?Hyperliquid coin has been gliding the EMAs too smoothly, where we are seeing strong buyside dominance. Just like last time we are going to keep an eye on EMAs (Specially the 200) for any possible breakdowns that might trigger bigger movement to lower zones, but while price stays above that EMA we are looking for further movement to upper zones, just like previouse times.
Swallow Academy
HYPEUSDT - Analysis for Immediate Long EntryChart Analysis
Looking at the daily chart, the story is pretty clear. HYPE has been in a powerful uptrend since April. We saw it hit a recent high of around $49-$50. As expected after such a strong run, a pullback has started.
The price has now retraced to the $42.50 level. This is significant. This exact area was the peak of the previous rally in early July. Old resistance becoming new support is one of the most reliable patterns in trading. The chart shows the price is currently testing this level. The small green arrows (fractals) on the chart confirm these key swing points. This is our entry zone. The setup looks solid for a long position.
Sentiment Analysis (The "Why")
Time to check the news to see if it supports our technical view.
Positive News:
"Zircuit Launches 'Hyperliquid' to Simplify and Secure Cross-Chain DeFi Trading" (1 hour ago): This is fresh, positive news. New integrations and launches on the Hyperliquid platform suggest ecosystem growth and user adoption, which is fundamentally bullish for the HYPE token.
"Whale Deposits $3M USDC for 20x ETH Long" (10 hours ago): This shows that large, sophisticated traders ("whales") are actively using the platform for significant trades. High volume and large positions signal confidence in the platform's reliability and liquidity.
"Ethereum News: James Wynn Opens 25x Leveraged Position Worth 12 Million on Hyperliquid" (1 day ago): More evidence of heavy hitters using the platform. This kind of activity can attract more users and build a strong reputation.
Negative News (The "Noise"):
"Hype News: Why is HYPE's price down today?" (3 hours ago): This article is likely just explaining the natural price correction we're seeing on the chart. It's not necessarily bearish; it's just market dynamics. A pullback after a strong rally is healthy and expected. It doesn't change the underlying bullish structure.
Overall Sentiment : The sentiment is bullish. The price dip appears to be a technical retracement, while the news flow points to strong fundamentals and growing adoption of the Hyperliquid platform. This combination of a technical setup and positive sentiment gives me the confidence to proceed.
The Trade Plan
It's time to define the levels. We're going long with a market entry now, around $42.50.
Entry Reason: Entering a long position based on the price retracing to a key support level (previous resistance) in a clear uptrend, supported by positive news flow.
Stop Loss (SL): $38.50
Reason: A break below $39.00 would invalidate our trade idea. This level is clearly below the current support zone and below the swing low from mid-July. Placing the SL at $38.50 gives the trade enough room to breathe without risking a catastrophic loss if we're wrong.
Take Profit 1 (TP1): $49.50 (Moonbag Target)
Reason: This is just below the recent all-time high of ~$50. It's a logical first target where the price might face resistance. Hitting this level would be the first confirmation that the uptrend is resuming.
Action: At this point, we take initial profits and move the trailing stop to our entry price to make the rest of the trade risk-free.
Take Profit 2 (TP2): $58.00
Reason: This is a psychological and technical extension level. A common way to project a target after breaking an all-time high is using Fibonacci extensions or measured moves. A move to $58 would represent a significant new leg up.
Action: When TP2 is hit, we move the trailing stop up to the TP1 level ($49.50) to lock in more profit.
Take Profit 3 (TP3): $65.00
Reason: This represents the next major psychological number and a potential area for a medium-term top. It continues the measured move projection from the previous price swings.
Action: When TP3 is hit, we move the trailing stop up to the TP2 level ($58.00).
Take Profit 4 (TP4): $75.00 (Final Target)
Reason: This is our "blue sky" target. In a strong bull market, assets can run much further than expected. $75 is a major psychological milestone and a reasonable final target for this trade.
Action: Close all remaining positions.
Conclusion:
The plan is set. The HYPEUSDT trade offers a good risk-to-reward ratio based on a solid technical setup and bullish sentiment. We enter now and manage the trade according to the plan. Let's see how it plays out.
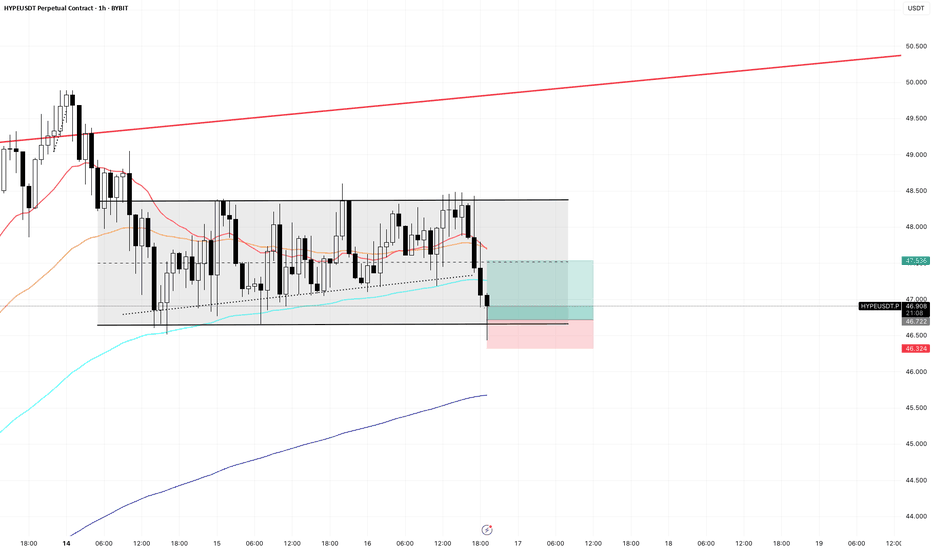
DOUBLE BOTTOM ON 4H CHART OF HYPE/USDTHype currently got rejected from 47.50 zone and took a sharp decline to last support level of 43.05 where it bounced from a day back as well.
Now we can see double bottom on chart and also fib level acting as a support
I am expecting hype to currently move towards 50 if this support zone holds.
Lingrid | HYPEUSDT potential Rebound from the Support ZoneThe price perfectly fulfilled my last idea . KUCOIN:HYPEUSDT recently surged above the triangle pattern and tested the key resistance near 50, forming a local top. After a healthy retracement, price is now approaching the blue upward trendline and support zone near 42, setting the stage for another bullish bounce. The structure reveals a higher low and a strong impulse leg, suggesting continuation toward the upper resistance area. The chart favors bullish continuation after retest confirmation of the ascending support.
📉 Key Levels
Buy trigger: Bounce from 42.5–43.5 zone
Buy zone: 42.0–43.0
Target: 50.0 with potential to 52.0
Invalidation: Breakdown below 40.0
💡 Risks
Failure to hold trendline support
False breakout rejection below 42.0
Broader market sentiment turning risk-off
If this idea resonates with you or you have your own opinion, traders, hit the comments. I’m excited to read your thoughts!
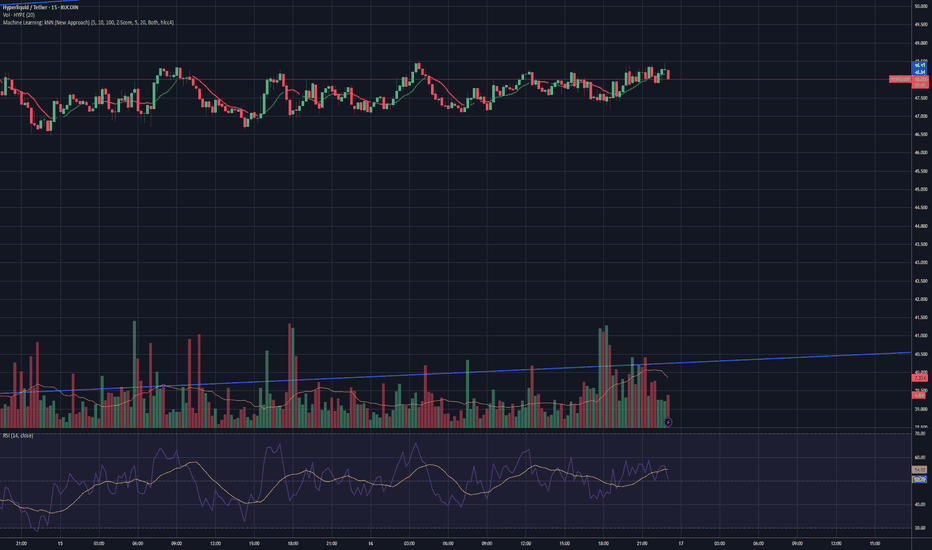
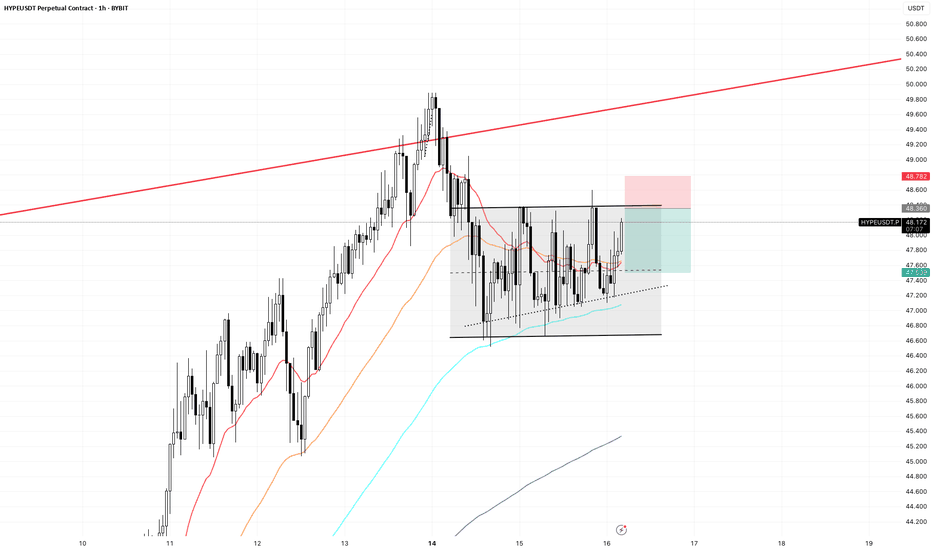
hyperhypeTechnical analysis of HYPE/USDT. The chart shows a prolonged sideways range after an impulse move, with regular volume spikes that don’t lead to continuation—likely the work of algorithmic trading or a market maker.
My questions: How can you distinguish between accumulation and distribution by a large player? When should we expect the start of a new trend?
Looking forward to opinions from experienced traders.
Real party starts when hype breaks out against btc pair Any meaningful crypto looking to enter top 10 territory will understandably be under the scope of some major btc whales . Since crypto assets for size buyers are carefully paired up against btc . The hype/btc chart should be the one that would catapult us into price discovery once we break agints btc. I anticipate large buyers to enter this trade
HolderStat┆HYPEUSD has consolidated above the trend line$OKX:HYPEUSDT surged after a breakout from a well-formed triangle and a bullish retest of prior resistance. The chart shows a textbook ascending channel with the price climbing from $38 toward the $56 upper range. If momentum remains, a breakout beyond the top boundary is likely.
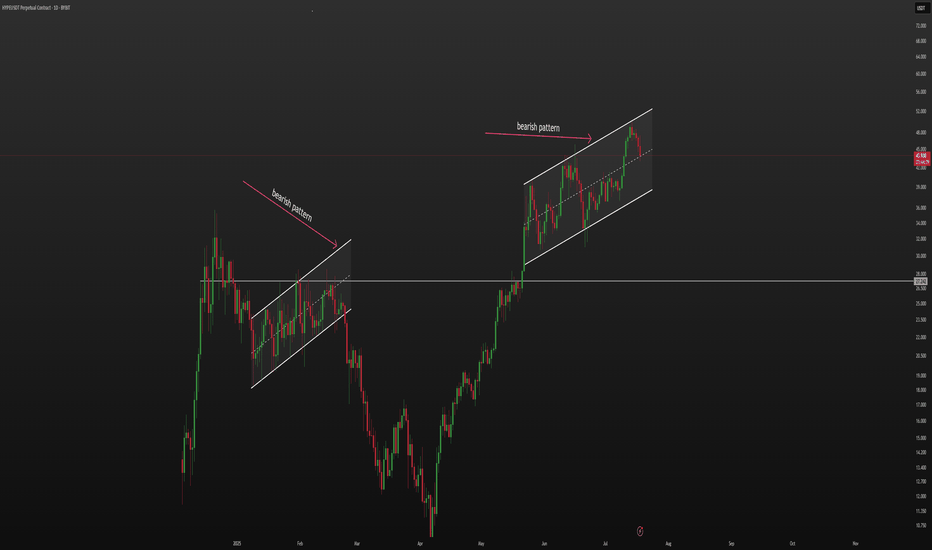
Hype - Resistance Levels to HigherCurrently you are looking at a rising wedge retest on Hype I
It will now either
1) Reject Here
2) Attempt to avoid having to go the full short target by pumping back up through the wedge.
Main Resistance Points coming up that makes be think we see a wick and through, failure to flip the wedge and back down lower
Daily Resistance / Fib Pivot Points
(Labeled On The Chart)
R3 / R2 / R1 / PP S1/S2/S3
$53.66 / $47.96 / $44.45 / $38.7 / $33.03 / $29.55 / $23.86
Fib 1.6 April Swing Low (TOP TOP) is $59 which likely is explored later t
HYPEUSDT KUCOIN:HYPEUSDT 4H Analysis Price has broken out above the 44.5 support zone and is holding strong 🚀. As long as this level holds, targets are set at 50.615 and 57.164 📈. If 44.5 breaks down, next support is seen at 40.433 🔻.
Key Levels:
✅ Support: 44.5
🟩 Targets: 50.615 → 57.164
🔴 Next support if breakdown: 40.433
HYPE/USDT -3 digit HYPE is currently ranked among the top 11 cryptocurrencies, backed by a fundamentally strong project with a highly credible team behind it. Market sentiment and investor interest are rising rapidly, and the long-term potential is undeniable.
Price has successfully reclaimed the $42 level, which previously acted as a major resistance zone. This breakout signals the beginning of a potential macro uptrend.
Given the current structure and momentum, we are targeting a three-digit price zone as a medium to long-term setup — a move that aligns with both technical structure and fundamental strength.
DeGRAM | HYPEUSD formed the triangle📊 Technical Analysis
● Price is coiling inside a fresh symmetrical triangle perched on the rising-channel mid-band (38.3 USDT); higher lows since 30 Jun show demand absorbing offers at support.
● A triangle breakout above 40.0 would reopen the run to the channel roof / June high at 43.8, while channel base is climbing through 36.0—creating a favourable risk-to-reward floor.
💡 Fundamental Analysis
● KuCoin’s 8 Jul launch of HYPE perpetuals and news of a GameFi partnership with Immutable X lifted spot volume 40 % w-w, hinting at fresh speculative inflows.
✨ Summary
Buy 38.0–39.0; sustained bid over 40.0 targets 43.8. Invalidate on a 4 h close below 36.0.
-------------------
Share your opinion in the comments and support the idea with a like. Thanks for your support!


