HolderStat┆HYPEUSD back to the trend line$OKX:HYPEUSDT is breaking out of a triangle formation, continuing a sequence of bullish consolidation and triangle patterns. Price is targeting the upper channel line near 42.75, with the structure supporting continued upside momentum.
HYPEUSDT trade ideas

Lingrid | HYPEUSDT Trend Continuation Pattern ConfirmedThe price perfectly fulfilled my last idea . KUCOIN:HYPEUSDT has respected the higher low structure and bounced from the lower bound of its upward channel. After a corrective move and consolidation above the $38.80 level, the asset has formed a trend continuation pattern. With bullish structure still intact, price is gearing for a breakout toward the $48.00 resistance area. Continuation within the channel keeps the upside scenario valid.
📈 Key Levels
Buy zone: $38.80 support with bounce confirmation
Buy trigger: breakout above trend continuation structure
Target: $48.00 major resistance and top of ascending channel
Invalid level: sustained close below $38.80 risks invalidation of bullish bias
💡 Risks
Loss of channel support would trigger bearish momentum
Volatility near resistance levels may cause fakeouts
Macro shifts in sentiment could delay the breakout pattern
If this idea resonates with you or you have your own opinion, traders, hit the comments. I’m excited to read your thoughts!

HYPE — Targeting Liquidity Below Monday Low1. While below Monday low — bearish, target liquidity
2. TP1: 35.34
3. TP2: 30.60
4. Above Monday low = scenario invalid

$HYPE - Short-term OutlookKUCOIN:HYPEUSDT | 8h
We're seeing a short-term distribution forming on the daily chart.
Price has now tested the supply zone around $42 three times and is struggling to break through.
There's local demand in the $34.5–$34 area, where I expect a reaction, in confluent with vwap. However, if price keeps getting rejected at $37–38, a move back to $30 is likely.
A break below $30 opens the door for a deeper drop toward $27–24, which is a higher timeframe demand zone.

HolderStat┆HYPEUSD forming the triangleKUCOIN:HYPEUSDT has entered a narrowing triangle formation with a bullish trajectory, forming higher lows from the 33 USDT base. Price is nearing resistance around 40 USDT, and if breached, the pattern projects continuation toward the 43.5 USDT level.

HYPE Swing Long – 5.2R Setup on Fib PullbackI’m planning to enter a HYPE swing long on a golden pocket pullback during a bullish structure continuation, with confluence from EMAs, fibs, and demand volume. The setup is based on the daily chart for trend structure and 1-hour chart for entry timing.
My stop is placed below structural invalidation, and I have two profit targets: one conservative (TP1) and one trend-continuation (TP2). I plan to move my stop to breakeven after TP1 is hit in order to protect the trade and let the rest run risk-free.
Entry at $39.20 – Inside the golden pocket (0.618–0.786 fib), where bullish pullbacks often reverse. Confluence with 21 and 50 EMA on the daily and high-volume support just below.
Stop-loss at $37.80 – Below structure and golden pocket. If broken, the setup is invalid and trend may shift.
TP1 at $43.00 – Previous local high and supply zone. Strong resistance and logical partial profit zone. Locks in ~2.7R. I plan to secure partial profits here and move my stop to breakeven.
TP2 at $46.50 – Full fib extension and psychological resistance. If trend continues, this is where momentum likely tops out short term. Gives ~5.2R.

$HYPEUSDT Trade Setup 4HKUCOIN:HYPEUSDT Trade
Entry: CMP
Stop Loss: $38.501
Target: $45.846, $56.845
Breakout from a triangle pattern with bullish MACD. Watch for retest entry.
DYOR, NFA.

HolderStat┆HYPEUSD above the $40 resistanceKUCOIN:HYPEUSDT has reclaimed $40 resistance and is now trending in a rising channel. Past triangle breakouts signal that $43–$45 could be next if the current momentum continues to build.

HYPEUSDT Probably CookedToken driven by demand from trading on Hyperliquid. Crypto looks set for a few month long consolidation probably into Q4.
That loss in trading volume will reduce demand for the token and the company may be forced to sell the token to come up with large gains for its clients. Either way it's a bearish catalyst for the token which has really ran hard. Ugly head and shoulders as well as a topping pattern in an overall financial market that looks like it wants a pull back

HYPEGETTEX:HYPE has 24 days left to invalidate the bearish rising wedge pattern. The good news is it has already invalidated the head and shoulders formation. Only time will tell how this plays out. I have my alert set at the resistance and I am ready for the breakout.

Hypecoin short to $38.5Recently opened a short position on hypecoinusdt. Not too late to get at least 2 RR I think. For faster updates follow me on x or....
For hypeusdt I anticipate a high probable correction down to at least $38.931 area...38.5 is a bit more optimistic but still calculative target.
2-3RR trade.
DTT strategy applied.

HYPE/USDT 15-minute high win scalping signals are as follows- Signal: LONG
- Entry: 38.48 ~ 38.60
- Take Profit: 38.92, 39.18

Hyperliquid (HYPE): Reached Zone of Rejection | Possible Drop ! Hyperliquid has reached the next resistance zone, where we are seeing some sort of weakness already. Now we are looking for a proper MSB from here, which would give us the last sign of possible downward movement so keep your eyes open for it!
Swallow Academy

HYPE — How to Combine Fibonacci, VWAP and Market StructureAfter an explosive +392% rally in just 70 days — from $9.298 to a peak of $45.8 — HYPE has entered a consolidation range as expected. Structurally, this appears to be a 5-wave impulse now transitioning into a corrective ABC pattern. Based on current structure, we may now be forming wave B.
What’s Unfolding Now?
A potential Head & Shoulders pattern is developing, with price currently working on the right shoulder. The $40 mark stands out as a key resistance — both technically and psychologically:
0.618 Fibonacci retracement of the down move sits at $40.108
Structural resistance from prior highs
Ideal area for a short rejection
🎯 Short Setup:
Entry: Laddered short between 0.618 ($40.108) and 0.786 ($42.611)
Stop-Loss: Above $44 (after rejection adjust to entry)
Target: $28–$27 zone
R:R potential: 1:3 up to 1:9 depending on entry quality
📍 Why $28–$27 Is Key Support:
0.5 Fibonacci retracement of entire +392% rally sits at $27.549
Anchored VWAP from the rally origin ($9.298) aligns around this zone
Weekly & Monthly S/R convergence
VAH (Value Area High)
0.618 Fibonacci Speed Fan also aligns as dynamic support
Fair Value Gap (FVG) lies in this region
Weekly 21 EMA at $28.05/Weekly 21 SMA at $24.10 — both key moving averages providing layered support and trend structure
📐 Bonus Confluence Insight:
If this is indeed wave B, then projecting a 0.786/1.0 Trend-Based Fib Extension from wave A aligns well with the 0.5 fib retracement at $27.5.
📚 Educational Insight:
Stacking confluences such as Fibonacci retracements, anchored VWAPs, volume zones, EMA/SMA levels, and harmonic structures helps identify high-probability zones where smart money is likely to act. These levels become even more powerful when they align across multiple tools and timeframes. Always confirm with price action.
_________________________________
💬 If you found this helpful, drop a like and comment!
Want breakdowns of other charts? Leave your requests below.

HYPE/USDT 15-minute high win scalping signals are as follows- Signal: LONG
- Entry: 37.260 ~ 37.360
- Take Profit: 37.680, 37.980

HYPEUSDT Short Triggered from ResistanceHYPEUSDT is showing signs of exhaustion near the 37.275 resistance level — an area where price has repeatedly failed to break higher. A short setup is in play, anticipating a rejection from this zone with downside potential toward key support.
Stop loss is placed above the previous swing high to protect against false breakouts, while take profit targets a clean support zone near recent consolidation.
🧩 Trade Setup:
- Entry: 37.275
- Stop Loss: 37.710
- Take Profit: 35.772
🔢 Risk:Reward Ratio:
- Risk: 37.710 − 37.275 = 0.435
- Reward: 37.275 − 35.772 = 1.503
- Risk:Reward: 1 : 3.45 ✅
🧠 Market Bias:
Short-term bearish reversal from resistance
📍 Setup Context:
-Price retesting major resistance zone
-Loss of momentum in uptrend
-Strong support level below

HYPE/USDT Ready for a Breakout? Watch These Key LevelsAnalysis Description:
The HYPE/USDT pair is currently forming a descending triangle pattern on the 1D timeframe — a classic technical setup that often signals a strong upcoming price move, either upward or downward.
🔶 Strong Support Block:
The yellow horizontal zone between 33.500 – 36.785 USDT represents a solid support area where price has repeatedly bounced with strong volume. This zone is ideal for monitoring buy-back opportunities if price pulls back.
📉 Descending Resistance Line:
A descending trendline has been acting as dynamic resistance. A breakout above this line could trigger a significant bullish continuation.
🎯 Upside Targets (If Breakout Occurs):
Target 1: 38.800 USDT (minor resistance)
Target 2: 42.068 USDT (mid-range target)
Target 3: 45.800 USDT (major resistance / previous high)
📌 Trading Strategy:
Conservative Entry: Buy on support re-test within the 33.500 – 36.785 USDT zone.
Aggressive Entry: Buy after a confirmed daily breakout above the descending trendline.
Stop Loss: Below the support block, around 33.000 USDT.
💡 Additional Note:
Watch for increased volume during the breakout — this would validate the move and confirm strong momentum. If the breakout fails, expect further sideways consolidation within the current range.
#HYPE #HYPEUSDT #AltcoinBreakout #CryptoChart #TechnicalAnalysis #CryptoTrading #DescendingTriangle #BullishSetup #CryptoCommunity

HYPEUSDT Long Setup After Bullish CompressionHYPEUSDT has formed a bullish ascending triangle — a price pattern suggesting an upward breakout. Price action shows tight compression with higher lows, indicating aggressive buyers stepping in.
The current long position is taken from a pullback entry at $35.404, just above the ascending support. The trade targets a breakout move toward $40.449, aligned with previous highs and psychological resistance.
Trade Setup:
- Entry: $35.404
- Stop Loss: $34.154
- Take Profit: $40.449
- Risk:Reward Ratio: 1:4.04
This setup anticipates a breakout continuation. A strong bullish candle above $38.30 could serve as confirmation. A break below the ascending structure would invalidate the trade.
Bias: Bullish breakout continuation
Trigger: Ascending triangle formation with compression toward resistance
Invalidation: Break below $34.154 (structure low)

Lingrid | HYPEUSDT potential Long After Correction in the MarketKUCOIN:HYPEUSDT is attempting to recover from a corrective dip, forming a higher low above the upward trendline and stabilizing near the 35.0 support zone. Price is currently testing a minor resistance and may confirm a bullish reversal if the structure builds a higher high above 38.5. A breakout toward the 42.0 level aligns with the projection, possibly extending into the 44.8 target area.
📈 Key Levels
Buy zone: 35.0 – 36.0
Sell trigger: break below 35.0
Target: 42.0 – 44.8
Buy trigger: bullish breakout from local structure
💡 Risks
Rejection below 38.5 may lead to further downside
Broad resistance near 42.0 could stall momentum
A breakdown of trendline support would invalidate the bullish setup
If this idea resonates with you or you have your own opinion, traders, hit the comments. I’m excited to read your thoughts!

HYPE: Distribution Zone — Best RR for Shorts?🎯 KUCOIN:HYPEUSDT Trading Plan:
Active Short Scenario:
Entry: $37–$45 zone
Invalidation: Daily closes above $45.8 (cut/derisk)
Partial TP: $27.5 (0.5 retrace), $22 (weekly gap), $13 (monthly demand)
No Longs:
Avoid opening fresh longs in this structure/zone
Wait for reclaim and closes above $45.8 for any long bias
🔔 Triggers & Confirmations:
Add on weakness/rejection at highs
Derisk or close if daily closes above range
🚨 Risk Warning:
Strong squeeze risk if range high breaks
Be disciplined with stops

Hypeusdt longOpened a long position on hypeusdt a while ago.
Stop: $36-35.575 area
Tp: $39.5
2-3RR depending on the stoploss you you chose

Hype's path to $55BYBIT:HYPEUSDT.P is currently forming a wedge shape pattern, is it indicating that it will break out and follow Path A, the blue path? I'm not so sure, I am sure we'll hit $55 either way.
If we take the red path, Path B, we'll come down to some heaviy support which could give us the fuel needed to get to $55
Out of all of the oscillators I was using, all except the chop zone on the daily mind you, were in bearish mode. So logically one would choose the red Path B right?
I can't wait to see how this plays out, shall we dip some and buy some more BYBIT:HYPEUSDT.P on Path B or experience more of a continuation of the current trendline to $55?
Let me know what you think in the comments, that'ls all for today, let's go HYPE!!! straight to $55!

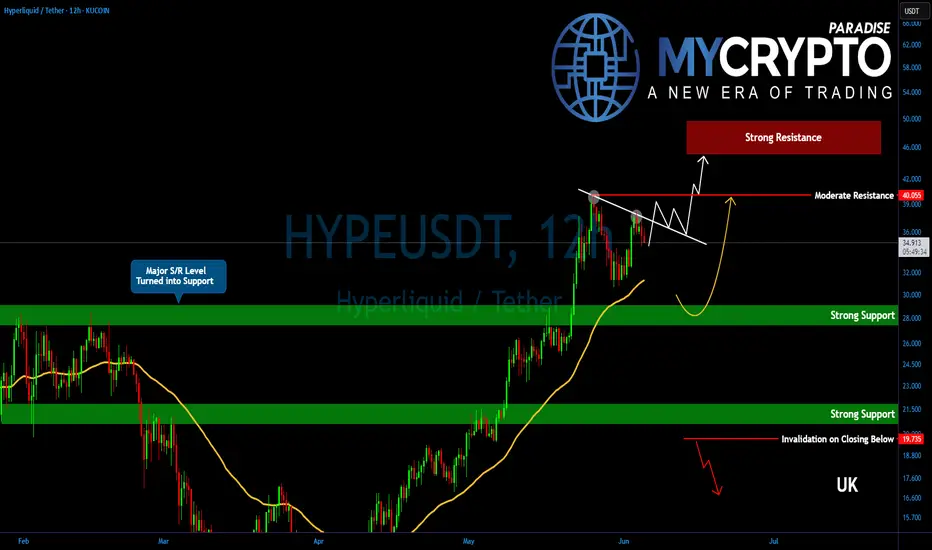
HYPE’s Triangle Is Tightening! Get Ready for What’s NextYello, Paradisers! Are you watching what #HYPE is doing while the rest of the market barely holds on? We've been talking about this for a while, some altcoins are setting up for their next big move, and HYPE just might be leading the pack.
💎While the broader crypto market remains in a corrective or consolidative phase, HYPE has quietly maintained strength, pushing above a critical support/resistance zone and now forming a converging triangle pattern, a classic setup for explosive movement.
💎#HYPEUSDT is in a sideways consolidation phase. Price action is calm on the surface, but what’s actually unfolding is a textbook build-up. The next move could be a retest of the EMA-50, which sits near the 31.480 level. That zone also aligns with a moderate support area, making it a solid demand zone for bulls to reload and re-accumulate.
💎Even if HYPE slides lower into the 30.00 to 28.00 strong support region, it wouldn’t damage the structure. In fact, such a move would shake out late longs and weak hands, further strengthening the overall foundation. A drop into that zone should not be seen as failure, but rather as a potential springboard for the next impulsive wave.
💎The key to watch remains the descending resistance at the 37.20 level. Once this is broken with volume and conviction, the price is likely to push toward 40.05—a moderate resistance. But don’t get it twisted. That’s not where the bulls are aiming to stop. The structure, momentum, and higher-timeframe alignment all suggest this isn’t the final destination. Bulls are likely targeting the $47–$50 range, an area that isn’t just technical, it’s psychological mark as well.
Paradisers, strive for consistency, not quick profits. Treat the market as a businessman, not as a gambler.
MyCryptoParadise
iFeel the success🌴