NG1!www.tradingview.com
It looks like Natural Gas hits a resistance. Let's be patient to see a confirmation before entering a long position.
Happy trading!
GNM1! trade ideas

UPDATE: Natural Gas hit Target 1 and now pumping to T2 $3.80W Formation formed during April 2024.
The price broke above the Neckline and headed straight to the target recently atr $2.85
The latest development has been an even larger Cup and Handle formation in the process.
This has been since February 2024. The price is breaking above the Brim level and the next target is set to around $3.80.
Looks good!

NATGAS Bullish Pennant! Buy!
Hello,Traders!
NATGAS is trading in an
Uptrend and the price
Has formed a bullish
Pennant pattern so we
Are bullish biased and
IF we see a bullish breakout
Then we will see a
Further move up
Buy!
Like, comment and subscribe to help us grow!
Check out other forecasts below too!

European Gas Volatility: Causes, Impacts, and Future OutlookThis analysis examines the recent volatility in European natural gas prices triggered by supply disruptions in Norway. Unforeseen outages at the Sleipner gas field and the Nyhamna processing plant resulted in a substantial reduction in gas flows, leading to a price surge of up to 13%. This episode underscores Europe's susceptibility to external gas suppliers and emphasizes the need for a multi-pronged strategy to bolster energy security.
Key takeaways:
Unplanned infrastructure shutdowns in Norway significantly impacted European gas supplies.
The incident exposes Europe's reliance on imported gas, highlighting vulnerability.
Rising gas prices have the potential to escalate production costs for industries and household energy bills.
Price volatility can contribute to economic deceleration, public dissatisfaction, and political pressure.
Effective policy interventions and long-term investments in renewable energy are paramount for ensuring long-term stability.

Natural Gas Price Forecast | Oil, Silver, GoldNatural Gas stock Bulls PEPPERSTONE:NATGAS Support & Resistance Guide
AMEX:UNG Stock Forecast
AMEX:USO Oil Stock Forecast
TVC:DXY US dollar Stock Forecast
TVC:GOLD OANDA:XAUUSD Stock Forecast
Silver OANDA:XAGUSD

Natural Gas Price Forecast | Oil, Silver, GoldNatural Gas stock Bulls PEPPERSTONE:NATGAS Support & Resistance Guide
AMEX:UNG Stock Forecast
AMEX:USO Oil Stock Forecast
TVC:DXY US dollar Stock Forecast
Gold OANDA:XAUUSD Stock Forecast
Silver OANDA:XAGUSD

NATGAS Trading Opportunity! BUY!
My dear friends,
Please, find my technical outlook for NATGAS below:
The instrument tests an important psychological level 2.503
Bias - Bullish
Technical Indicators: Supper Trend gives a precise Bullish signal, while Pivot Point HL predicts price changes and potential reversals in the market.
Target - 2.683
About Used Indicators:
Super-trend indicator is more useful in trending markets where there are clear uptrends and downtrends in price.
———————————
WISH YOU ALL LUCK

NATURAL GAS Rejection at the top of the Falling WedgeNatural Gas (NG!) hit last week the top (Lower Highs trend-line) of the long-term Falling Wedge pattern that started on the April 10 2023 Low and was immediately rejected back to the 1W MA50 (blue trend-line).
As long as it holds, this rejection indicates that technically, the new Bearish Leg should start. Our Target is 1.550 (just above Support 1). If however the trend reverses and gives a candle closing above the Lower Highs, we will take the sell's loss and buy instead, targeting 3.300 (projected 1W MA100 extension).
-------------------------------------------------------------------------------
** Please LIKE 👍, FOLLOW ✅, SHARE 🙌 and COMMENT ✍ if you enjoy this idea! Also share your ideas and charts in the comments section below! This is best way to keep it relevant, support us, keep the content here free and allow the idea to reach as many people as possible. **
-------------------------------------------------------------------------------
💸💸💸💸💸💸
👇 👇 👇 👇 👇 👇

NATURAL GAS: Rejection on the 7 month Resistance.Natural Gas is only marginally bullish on its 1D technical outlook (RSI = 56.609, MACD = 0.187, ADX = 40.616) as it failed to cross over the LH trendline. At the same time, it is supported on the 1D MA200 having broken out for the first time since January 3rd. Long-term we remain slightly bullish on NG but on the short-term, we will wait for LH validation. If the price crosses above it, we will take a short term buy and aim for the R1 level (TP = 3.350). If instead the price crosses under the 1D MA200, we will take a short term sell aiming at the 1D MA50 (TP = 2.200).
See how our prior idea has worked out:
## If you like our free content follow our profile to get more daily ideas. ##
## Comments and likes are greatly appreciated. ##

Natural Gas Price Forecast | DXY Oil, Silver, GoldNatural Gas stock Bulls NatGas Support & Resistance Guide
AMEX:UNG Stock Forecast
USO Oil Stock Forecast
DXY US dollar Stock Forecast
Gold XAUUSD Stock Forecast
Silver XAGUSD

Natural Gas every 4 years The natural gas markets have broken above the crucial $2 level, and it looks like we are probably going to continue to go higher. All things being equal, the short-term pullback should be buying opportunities that we take advantage of. This is an investment. This is not a short-term smash and grab trade. Keep in mind that supply is still a major issue with natural gas, but perhaps people are starting to realize that there’s natural gas in the Middle East and maybe geopolitical issues come into the foray and drive prices higher.
Nonetheless, I don’t think this is a long-term issue. I do think that you’re looking to buy dips in a lowly levered position, in my case an ETF, and just hanging on to it for the majority of the year as an investment. I think we could go for $2.50, but it’s going to take a while.
Credit: Christopher Lewis - FX Empire

Natural Gas Price Forecast | Oil, Silver, Gold, DXYNatural Gas stock Bulls PEPPERSTONE:NATGAS Support & Resistance Guide
AMEX:UNG Stock Forecast
AMEX:USO Oil Stock Forecast
TVC:DXY US dollar Stock Forecast
Gold OANDA:XAUUSD Stock Forecast
Silver OANDA:XAGUSD

Natural Gas ShortPrice breached resistance with a strong red candlestick. We were overbought on RSI and we are in a pullback that may reach first the white line at $2.34.
MACD supports this, as the histogram shows strong downward selling pressure and the MACD is below the signal line in the 4H chart.
Also we are looking a divergence in RSI, doing lower lows, but we still have to wait for price to see if it will rebound before reaching the white line to have the divergence in price completed and with a new local higher low, but until so, Natural Gas is bearish.

NATGAS: Bullish Continuation
The strict beauty of the chart is a reflection of the fierce eternal battle between the bulls and bears and right now I can clearly see that the bulls are taking over so we will bend to the will of the crowd and buy too.
❤️ Please, support our work with like & comment! ❤️

NG: Potential to catch trend for magnet to weekly magnet zoneRare Bull BO of bull channel, coming up off higher TF Demand zone, potential magnet to higher TF supply.
Showing increasing bull momentum, if continues looking to ride some long.


Natural Gas Price Forecast | Oil, Silver, GoldNatural Gas stock Bulls NatGas Support & Resistance Guide
UNG
Stock Forecast
USO Oil Stock Forecast
DXY US dollar Stock Forecast
Gold XAUUSD Stock Forecast
Silver XAGUSD

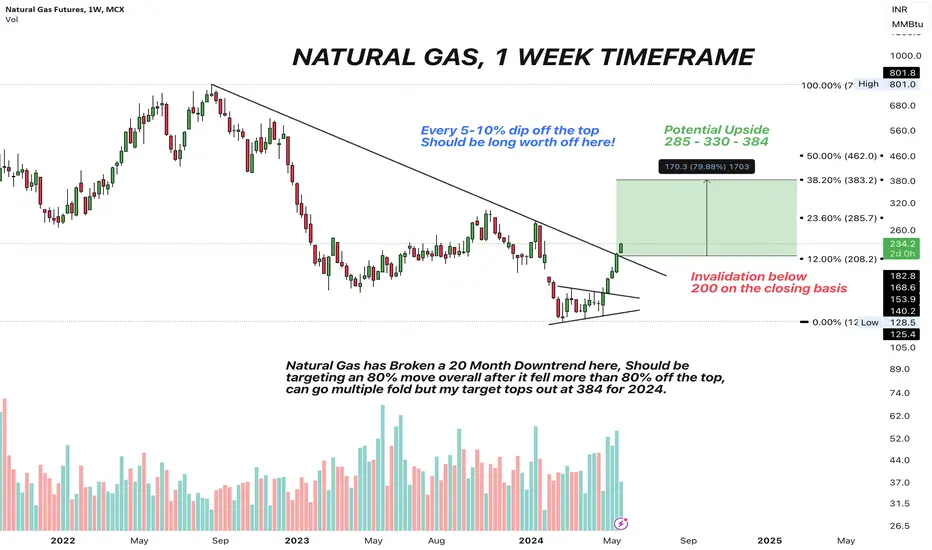
NATURAL GAS BREAKOUT WILL TARGET 80% IN 2024We have a major downtrend breakout here and we can now expect upside, rest of the information is in the chart itself.
Natural Gas Price Forecast | Oil, Silver, GoldNatural Gas stock Bulls NatGas Support & Resistance Guide
AMEX:UNG Stock Forecast
USO Oil Stock Forecast
DXY US dollar Stock Forecast
Gold XAUUSD Stock Forecast
Silver XAGUSD

Natural Gas (NG1! NGAS) at the historic low#NG1! #NGAS is at its historic low. Bottom of all bottoms. Every time commercials start offloading their long positions AND the price getting close to $1.5 it ends up with multi-year bullish momentum. (Since 1991)

Natural Gas Price Forecast | Oil, Silver, Gold Natural Gas stock Bulls NatGas Support & Resistance Guide
AMEX:UNG Stock Forecast
USO Oil Stock Forecast
DXY US dollar Stock Forecast
Gold XAUUSD Stock Forecast
Silver XAGUSD

NATGAS: Bearish Continuation is Highly Probable! Here is Why:
The recent price action on the NATGAS pair was keeping me on the fence, however, my bias is slowly but surely changing into the bearish one and I think we will see the price go down.
❤️ Please, support our work with like & comment! ❤️

NATGAS The Target Is DOWN! SELL!
My dear friends,
Please, find my technical outlook for NATGAS below:
The instrument tests an important psychological level 2.638
Bias - Bearish
Technical Indicators: Supper Trend gives a precise Bearish signal, while Pivot Point HL predicts price changes and potential reversals in the market.
Target - 2.455
About Used Indicators:
Super-trend indicator is more useful in trending markets where there are clear uptrends and downtrends in price.
———————————
WISH YOU ALL LUCK
