WHAT'S FLOWING: METALS | FX | CRYPTOS | COMMODITIESXPDUSD (Palladium): Bearish outlook. The chart indicates potential resistance around the current price levels, suggesting a downward move may be in play.
AUDCHF: Bullish. Positive price action with upward momentum signals the potential for gains, as AUD strength seems to dominate CHF.
CADCHF: Bullish. Similar to AUDCHF, CAD is showing strength against CHF, pushing higher and creating opportunities for bullish plays
GBPAUD: Bearish. GBP appears to be under pressure against AUD, with price action leaning towards a decline, signaling a potential short opportunity.
JPN225 (Nikkei): Bullish. Japan's index is holding strong and showing signs of further upside, making it a favorable option for long positions.
LNKUSD: Bullish. Link (Chainlink) is experiencing upward momentum, making it a strong candidate for a continuation in price appreciation.
XLMUSD: Bullish. Stellar Lumens (XLM) is also looking strong, with buying pressure indicating potential gains in the near term.
CCZ2024 (Cocoa Futures): Bearish. Cocoa futures seem to be in a downtrend, with bearish signals suggesting lower prices ahead.
C1! trade ideas

Cocoa Crisis 2024 skyrockets prices, outperforming S&P500
The price of cocoa has risen 130% this year, making it the most revalued commodity, surpassing even copper. There are two times of the year when cocoa is harvested, and poor rains and crop diseases have dented the crop in Côte d'Ivoire and Ghana, responsible for more than half of the world's cocoa supply, pushing prices higher.
The latest estimates from the International Cocoa Organization (ICCO) point to a shortfall of 462,000 metric tons, with demand exceeding supply. This is the third upward revision to the shortage this year, driven by adverse weather conditions and persistent demand for chocolate.
Cocoa, which touched an all-time high of $11,800 per tonne in March, is threatening to break above $10,000 again, reflecting a tense and tight market. The cocoa rally not only eclipses other commodities not only food commodities but also some metals such as copper or aluminum, but also outperforms the major stock market indices. This year, the orange is up 55%, a far cry from the 130% rise experienced by cocoa. It is eclipsing the performance of the S&P 500, the world's benchmark index, which has shown a return of around 23% in 2024.
Looking at the chart it can be seen that currently the checkpoint zone (POC) is located around 7660 points and the RSI is located in the middle zone slightly overbought at 51.88%. Seeing the falling formation since April, with two successful attempts to pierce the 8697 points range in May. If this psychological zone is pierced we could see a climb towards highs accompanying the previously mentioned shortage news in a year with many price convulsions.
Ion Jauregui - ActivTrades Analyst
*******************************************************************************************
The information provided does not constitute investment research. The material has not been prepared in accordance with the legal requirements designed to promote the independence of investment research and such should be considered a marketing communication.
All information has been prepared by ActivTrades ("AT"). The information does not contain a record of AT's prices, or an offer of or solicitation for a transaction in any financial instrument. No representation or warranty is given as to the accuracy or completeness of this information.
Any material provided does not have regard to the specific investment objective and financial situation of any person who may receive it. Past performance is not reliable indicator of future performance. AT provides an execution-only service. Consequently, any person acing on the information provided does so at their own risk.

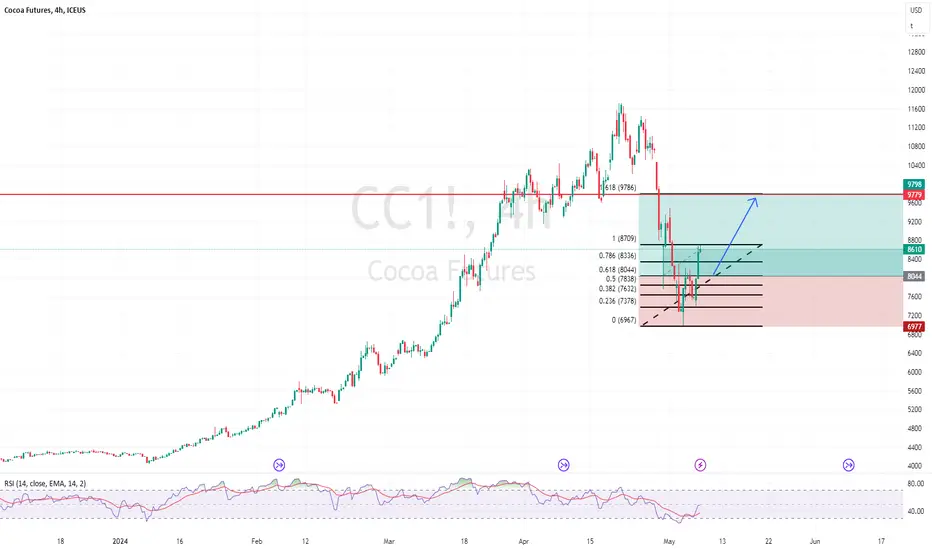
COCOA LONGCocoa (ICE) price oscillated in a rectangular pattern. Price finally made a breakout, after the breakout the price retraced because it hit the 61.8% golden ratio Fibonacci level (not plotted in this chart), then continued its path upwards.
After measuring the rectangle height, I projected it to define a possible target of 9636 or so.
Then I corroborated this with an ABCD pattern projection, of CD being 161.8% of BC, and having a target of 9636 too.

Cocoa Futures Long position - triangle chart patterns
Buy MKT ( Market order) at the current market price - 8092
And bonus buy limit at price 7721
Stoploss 7521
Take profit 8921 and 9609

The Cocoa price can now fall as fast as it rose in six months.The Cocoa price tripled in six months from autumn 2023 to February 2024. So what now? Some have predicted that the Cocoa price will continue to skyrocket? Probably not..
The Cocoa price can now fall as fast as it rose in six months.
Technical Analysis of Cocoa Futures:
If we first look at the short-term picture now for Cocoa futures, then the course is moving within a right-angled descending triangle formation, which indicates further decline going forward both in the short and medium term for Cocoa Futures.
There is now resistance around the USD 8,600 level (cf. chart) and the technical picture signals decline from this level, and a new test soon of the now important technical support level around USD 6,800.
Should there be a break down from the aforementioned right-angled descending triangle formation, and a break down below the now very important technical support level around USD 6,800.
Yes, then a strong technical sell signal will be triggered for Cocoa Futures, which then, and according to the long-term trend (cf. weekly chart) will then be able to fall all the way down towards the lower trend line in the long-term rising trend, and down towards around USD 3,700 (cf. weekly chart).
Important technical levels to watch in the near term for Cocoa futures are whether there should be an established break above the USD 8,600 level, or whether there should be an established break below the USD 6,800 level.
These are two important technical levels now in the short term to keep an eye on for Cocoa Futures, and an established breach of one of these two now important technical levels, yes it will help give new signals about the further development going forward for Cocoa Futures .
As the overall technical picture for Cocoa Futures looks as of today, it is indicated that Cocoa Futures will fall back into the previous uptrend, and have a strong correction down towards the support level at the lower trendline in this long-term uptrend.
That would mean a strong correction down from the current level for Cocoa Futures at USD 8,560 and down towards USD 3,700.

[CC1!] Cocoa end of correctionOn this asset I have been looking for since a while, I took my first entry around $7,000 rejection and first TP at $10,000.
Today I can see another entry point for my trade and will wait now for a break of the $10,000 with potential new ATH.
Great Trade !

Sell Sept. Cocoa at 80.40 limit, stop 86.60, target 71.60Looking at the volatile cocoa market, trying to take advantage of the swings: sell Sept. Cocoa at 80.40 limit, stop 86.60, target 71.60

COCAO is bitter~Cocoa bull run is over! This a very high probability chart setup for a big down move over time.
If you made your money take it and run!
If you never owned it watch the chart and learn
If you are short Enjoy your gains don't be quick to take profits.

Macro Monday 50 - The Ivory Coast~The Cocoa Centre of the WorldMacro Monday 50
The Ivory Coast ~ The Cocoa Centre of the World
This week we will look at the investment opportunities presenting in the Ivory Coast which is the world’s largest producer of cocoa. This booming economy is expected to continue grow at a 6.6% GDP growth rate which competes with the likes of India (covered on a previous Macro Monday). Today we will cover the Ivory Coast Stock Index - the BRVM Composite Index, the cocoa futures market and also a little history on the west African region. We will also learn a little about the uniqueness of the cacao tree.
All of this information is valuable to anyone considering investing in the cocoa markets, the Ivory Coast or West Africa. If you’re an investor seeking unique commodity exposure or seeking to plant some seeds in a sprouting economy, you’ve come to right place. I will also review cocoa through a commodity lens and why many factors present cocoa as a unique trading opportunity and a commodity worth keeping an eye on.
The West Africa’s produce 70% of global Cocoa
Currently 70% of the world’s cocoa beans are produced in West Africa by the Ivory Coast, Ghana, Nigeria and Cameroon. If you ate chocolate this week, it very likely came from one these countries.
The Ivory Coast produced 2.2 million tons of cocoa in 2022 accounting for over 30% of the global supply of cocoa, making it the largest cocoa producer in the world. In the 2023/24 cocoa season this reduced to 1.8 million tons.
Also known as Côte d’Ivoire, the Ivory Coast is joined to the east by the world’s 2nd largest cocoa producer Ghana, which produced 1.1 million tons of cocoa in 2022 (approx. 20% of the global supply). In the 2023/24 season this reduced to 820,000 tons.
The recent decline of cocoa production from the two largest producers indicates the 2024 season could spawn a supply shock in cocoa, increasing the value of the commodity. Many factors have caused this decline in production some of which we will discuss later in this article.
Other notable cocoa producers include Indonesia (667,000 tons), Ecuador (337,000 tons), Brazil, Peru, and the Dominican Republic. Together, all the countries combined with the aforementioned Ivory Coast and Ghana contribute the majority of the world’s cocoa supply.
Cocoa is essential to the chocolate industry as are other products derived from cocoa beans. The production and trade of cocoa are vital for the economies of these countries, providing income for millions of small farmers and workers involved in the cocoa supply chain. Agriculture in these regions are driving major financial interest. Banks and telecommunications firms are growing rapidly, and all from producing one of the worlds most desired foods.
Top 6 Exports from the Ivory Coast
Ivory Coast’s main exports and their values in USD billions based on the most recent data from 2023:
1. Cocoa Beans: $3.33 bln
2. Gold: $2.12 bln
3. Rubber: $2.11 bln
4. Refined Petroleum: $1.88 bln.
5. Cocoa Paste: $1.08 bln.
6. Fruits and Nuts (incl cashews & coconuts): $1.2 billion.
The Ivory Coast Economy is in Growth mode
The GDP growth for Ivory Coast in 2024 is expected to be robust. According to the International Monetary Fund (IMF), the country’s GDP growth is forecasted at 6.6% for the year. This positive outlook is consistent with Ivory Coast’s trend of strong economic performance in recent years. The growth is driven by a diverse economy with strong sectors such as agriculture, manufacturing, and services, contributing to its status as one of the leading economies in the West African region.
The French Connection
In case you’re wondering in, 1893 Ivory Coast was made a French colony. In 1904, Ivory Coast became part of French West Africa. During World War I and World War II, Ivorian soldiers fought for France. The Ivory Coast is a Francophone country, and in 2024, French is spoken by 10 million people out of 28.9 million (33.61%). Abidjan is the city with the third biggest French speaking population anywhere in the world. It is also the fourth most populous city in Africa, with about 4.7million people living there. In international relations, Françafrique (English pronunciation: Frawn-sah-frique) is France's sphere of influence (or pré carré in French, meaning 'backyard') over former French and (also French-speaking) Belgian colonies in sub-Saharan Africa.
At present Côte d'Ivoire is Frances leading trading partner in the CFA franc zone (WAEMU countries) and the third-largest in sub-Saharan Africa, after South Africa and Nigeria. France is Côte d'Ivoire's second-largest trading partner after China. As you can see, the Ivory Coast has very strong trading ties in Europe.
Demographic Snapshot - Ivory Coast
The population is c. 30 million with a median age of 19 years old. 60% of the population are under the age of 25 (as of 2020 figures) presenting a very young work abled demographic.
Ivory Coast’s Booming Stock Market in 2023
The Ivory Coast had a booming stock market in 2023 and the country as a whole appears to be presenting great economic strives and monumental investment potential.
Lets have a look at the Ivory Coast Stock Index.
The Ivory Coast Stock Index - The BRVM Composite
The Bourse Régionale des Valeurs Mobilières (BRVM) is the regional stock exchange of the member states of the West African Economic and Monetary Union (WAEMU): Benin, Burkina Faso, Côte d’Ivoire, Guinea-Bissau, Mali, Niger, Senegal, and Togo. I have provided a map on another platform of these countries of which the link in is my profile.
BRVM Composite Components
The BRVM Composite is made up of 46 stocks with 39 of these companies based in the Ivory Coast and 7 based in neighboring countries. Many of the companies operate through individual subsidiary’s in each of the WAEMU countries. The Ivory Coast index provides an interesting mix of growth stocks in the Banking, cocoa production and manufacturing alongside other fruit and nuts, gold mining, telecommunications and tourism. The country is commodity rich and has the workforce to produce at scale.
The BRVM trades in the West African CFA franc, which is usually abbreviated as XOF. This currency is used by the countries in the West African Economic and Monetary Union (WAEMU), providing a stable and uniform platform for financial and economic activities within the region.
The BRVM experienced a remarkable year in 2023, with a notable performance that saw the share price of eight stocks climb into double digit figures. Additionally, the stock market’s total value made a historic leap, surpassing the CFA franc 8 trillion threshold (equivalent to approximately $13 billion USD) for the first time ever in Sept 2023.
The BRVM Composite top 5 companies by Market Cap
1.Sonatel, AKA Societe Nationale des Telecom has a market cap of CFA 1.93T ($3.2 billion USD). Accounts for approx. 20% of the entire BRVM Stock Exchange equity market.
-A major player in the telecommunications sector in West Africa, providing a range of services including fixed-line telephony, mobile communication, internet, and television.
2. Orange Côte d’Ivoire has a market cap of CFA 1.73T ($2.9 billion USD) is listed on the BRVM Stock Exchange under the ticker symbol “ORAC”. Also accounts for approx. 20% of the BRVM.
-Orange Côte d’Ivoire is a subsidiary of the French group Orange and is a leader in telephony in Côte d’Ivoire, offering fixed, mobile, and internet services, as well as mobile payment services with Orange Money.
3.Societe Generale de Banques has a market cap of CFA 631 billion ($1 billion USD)
-A subsidiary of the French multinational bank Société Générale, it offers a wide range of banking products and services to individuals, corporations, institutions, and professionals in Ivory Coast.
4.Ecobank (ETI) has a market cap of CFA 396 billion ($636 million USD)
-Also known as Ecobank Transnational Inc. (ETI), it is a pan-African banking conglomerate with operations in 33 African countries. It serves both wholesale and retail customers and is a leading regional banking group in West Africa and Central Africa.
5.Coris Bank has a market cap of CFA 328 billion ($525 million USD)
-This is the second-largest banking group in Burkina Faso, providing retail, corporate, and Islamic banking services. It also offers a variety of banking products and services, including e-banking and foreign exchange.
As you can see in terms of USD these companies are only sprouting and have a lot of growth potential. These companies are obviously benefiting from major agricultural and infrastructural growth in this blooming economy.
Now onto the chart.
The BRVM Composite Chart is presently not available on Trading View however you can view it on Investing.com. When it becomes available here I will share it.
✅The smooth moving average on the chart is the 200 day SMA (or the 40 week moving average) which appears to have acted as float for price and is sloping upwards with diagonal support.
✅We can clearly observe an ascending triangle also which suggests much higher prices are plausible.
⬜️ At present this chart is not available on TradingView (even though it is powered by TradingView on another platform). I have requested it to be added to allow us to structure a trade more systematically. If it is added I will share the chart on TradingView so that we can monitor it more closely and create and interactive chart to track.
Now lets take a look at the Cocoa Futures chart.
Cocoa Futures Chart (ticker: ICEUS:CC1! )
This is the Subject Chart Above at the heading of the artical.
The cocoa futures chart is trending strongly bullish.
✅We have found support off the 21 week SMA (blue line) several times since 2022 and we can expect this to continue with such a bullish trend in place.
☑️In the event price closes below the 21 week we can then start looking for a sizable correction down to $6,545. Outside of this, the chart is looking great.
✅IMO the most likely outcome is for the price to blast on up to an all-time high or consolidate sideways until the end of the Sept 2024, after which we would likely have a DSS Bressert cross and continue to move higher. Consolidation after a 375% + increase in price since Jan 2023 would be fairly standard procedure. This includes the scenario of a fall to $6,545 which I would still consider a consolidation move, however I find this less likely of an outcome.
Many factors are driving the price of Cocoa up, we will look at some key factors and concerns in the cocoa market below.
The Cacao Tree Requires a Specific Climate to Grow
Cacao is cocoa in its raw, less-processed form. Cacao grows from trees called Theobroma cacao. Cacao trees are native to South America, West Africa, and some countries in Asia. Its quite incredible how the plant can only thrive in very specific regions called Equatorial Zones.
The 3 main species of Theobroma Cacao prefer an equatorial-humid climate, with nearly year-round constant specific humid temperatures. The areas are often coastal or have coastal drafts, have low elevations and super dense humidity. The Cacoa Tree doesn’t mind the heat as much as Coffee Arabica, but it absolutely needs nearly super-saturated water vapor in the atmosphere to survive. The cacao leaf is not very glossy, so if the air is too dry, it will lose all of its water to the detriment of its fruit.
Roughly 35 cacao seeds are generated from each hanging fruit which is then fermented and roasted to create our beloved chocolate taste. This process can take a few days to a number of weeks. The raw form of cacao is much more bitter and can be difficult to eat, albeit I recently discovered it is a great coffee replacement. Interestingly, Both are the seed of a fruit — the coffee "cherry" and the cacao pod that contains 35seeds or beans. While much of chocolate's flavor is developed during a lengthy fermentation process, for coffee, a short fermentation has less impact on flavor and is more a means of separating the seed from the fruit. Both Coffee and Cocoa offer natural stimulants; caffeine for coffee and theobromine for Cacao.
The main Cacao crop growing season is from Oct - Mar (yielding c.80% of annual produce) and the secondary season is May to Aug which yields c. 20%. At present a tree virus is causing significant issues reducing crops by up to 50%, we will discuss this below.
Cocoa Virus Killing up to 50% of Cocoa trees
Unfortunately, a rapidly spreading virus threatens the health of the cacao tree and the dried seeds from which chocolate is made, jeopardizing the global supply of the world's most popular treat.
As noted above, about 50% of the world's chocolate originates from cacao trees in the West Africa countries of Ivory Coast and Ghana. The damaging virus is attacking cacao trees in Ghana, resulting in harvest losses of between 15 - 50%. Spread by small insects called mealybugs that eat the leaves, buds and flowers of trees, the cacao swollen shoot virus disease (CSSVD) is among the most damaging threats to the root ingredient of chocolate.
"This virus is a real threat to the global supply of chocolate"
Benito Chen-Charpentier (professor of mathematics at The University of Texas at Arlington and an author of "Cacao sustainability)
Ghana has lost more than 254 million cacao trees in recent years, and the best measures to address the virus are an expensive vaccine (heightening cost) that renders a smaller plant (reducing yield). Farmers are attempting to separate the plants by greater distances however, this results in a similar issue with lessor plants and reduced supply/returns.
In summary the virus could cause a major global cocoa shortage causing a major supply shock to the cocoa industry, even the news of this event could cause the value of cocoa to rise. Combine this with the secondary season ending in Aug 2024 poorly, and we are setting up for a cocoa shortage coming into the cocoa demand Christmas season.
Ivory Coast and Senegal Clear Leaders in West Africa
Finally, I wanted to recognize that the Ivory Coast is not on their own and many of the countries around them are also thriving. The Ivory Coast and Senegal both play significant roles in the West African Economic and Monetary Union (WAEMU). The Ivory Coast is often considered the powerhouse of the union, contributing a substantial portion of the region’s GDP. It is the driving economy within WAEMU, with a notable share of the nominal GDP of the zone. On the other hand, Senegal is recognized as the second-largest economy in the WAEMU area and has been making strides in economic growth and development through initiatives like the Emerging Senegal Plan (PSE). While Dakar, Senegal, hosts the Central Bank of West African States (BCEAO), which is crucial for the financial stability and monetary policy of the WAEMU, the Ivory Coast’s economic weight within the union is also significant. Therefore, both countries can be seen as key financial centers in their own right within the WAEMU context, with the Ivory Coast leading in economic size and Senegal in its strategic role hosting the BCEAO.
The Hunt for West African Brokerages
I am in the process of hunting for safe and reliable brokers in the Ivory Coast and West Africa’s region. I have found some but I could not recommend them until I do some testing and get some opinions. If anyone has any information on this, I would be very happy to have it and share it with the community here. In any event, I will look for easier indexes also that include exposure to the these countries and to Cocoa.
Interactive Charts on TradingView
All these charts are available on my Tradingview Page and you can go to them at any stage over the next few years press play and you'll get the chart updated with the easy visual guide to see how Ireland's stock market has performed. I hope its helpful.
I wrote this and consumed a whole bar of 85% Lindt Chocolate….hard to believe the journey it took to reach here.
Thanks again for coming along,
PUKA

Cocoa Daily ChartCocoa Futures Falling Off A Cliff on Daily Chart.
Charts gave clues of this possibility BEFORE the fall... if you observed attentively the details.
#cocoa #inflation

Will Cocoa continue to rise?I think so given that the structural changes that led to its surge are still valid, demand is growing and for now there are no valid alternatives.
Maybe we could be in the midst of an ABCD pattern, who knows...
This is how I got in, ideas or advice are welcome.
Greetings

A Simplified Model for Bubbles. This post is to test a hypothesis we can break bubble moves down into five main stages and with these we can have a reasonable idea where we might be in that move.
Here I've marked up the phases on Cocoa and I'll also show some others that have similar phases.
Broadly understanding the phases of a bubble and crash is not as grandiose a claim as it's made out to be. My idea that bubbles and pops can be understood is based on my opinion that various TA methods do a good job of explaining trend development. When major bubbles and pops of the are viewed in hindsight, they have obvious finger prints of bull/bear trend development.
Trend development models and theories are something we can develop and test trading over smaller timeframes. On 5 minute charts little bubbles and crashes happened daily. On hourly charts they happen weekly. Daily charts you see them over months. If you can test thing to work on these timeframes, it's perfectly valid to scale that to weekly/monthly.
My premise is the overall rules of trend development are not significantly different from the rules of intraday/week/month development.
Through the last years I've tested models I have for bull trend reversals with varying effects. I could tout various instances of forecasting major reversals in 2021/2022 and show a very timely switch to bull in 2023. The models have had many successes. They've also had many misses. I've learned a lot about the limitations of various things.
This is an attempt to combine the original trend development ideas I had with real experience of attempting to establish the major swings in moves over the last years and apply that to some current charts that have people's attention. Charts that as per this bubble template would be in heading into the reversal swings.
First let's expand on the five stages;
Stage one:
During stage one there will be an obvious uptrend. The trend won't be of an exceptional angel but it will be progressively heading higher. It will probably look like it's going up quickly in real time, but when viewed later this was a very slow section of the trend. Lots of pullbacks likely in this phase.
Stage one has an uptrend but it does not have a lot of people believing in it. In fact, what's most common is stage one is people pointing out the reasons the trend is unsustainable.
Stage two :
Stage 2 is a crash section of the move. The bull trend breaks. At this time there are not a lot of calls for dip buying, a more popular tone is "Told you so". People have been expecting the rally to fail and are vindicated. During this time is the best possible time to buy but it'd be a highly unpopular opinion to defend in the public arena.
Stage three:
The doubling. A magnificent trend. It defies doubters time and time again until few people dare to doubt and those who do are subject of mockery. There's been a full shift from those being bullish being the outcasts to those being bearish being the outcasts. By this time the asset in question should be the darling of market related forums.
Note - I've called this the doubling phase but it can be a bit more/less. What's important is it a massive advance of the trend. Which massively changes sentiment.
Stage 4
Stage 4 is a false reversal. Heading into stage 4 it's unpopular to be a bear. Usually by this stage we're seeing people buying the asset with no previous investing background (Or nothing of a speculative nature like this). It not only has public acceptance but it's shrouded in eternal optimism.
Note: It is possible the optimism around the asset in question is long term valid. This does not remove the risk of 70 - 90% drawdowns. A standard part of trend development is to make a first trend leg. Correct almost all of that trend leg. Then head into a far larger and longer trend. An example would be the 1920's rally and crash. Was going higher, late 20's was bad time to buy.
Stage 5
In stage 5 bulls become geniuses and bears become stupid. Stage 5 is where an unshakable belief in the trend is formed by bulls and even the most staunch of bears is having trouble shorting it. If they're not shy about when they're short, they do not have money to short any more. Stage 5 is a tough time to be a bear.
Stage 5 is a really strong spike out. Coming off the stage 4 bear trap it really solidifies the idea this trend can overcome anything. It is the strongest section of the trend. Brief, but aggressive.
NVDA
Maybe the the most loved/hated stock in the world. Lot of strong opinions on NVDA. I personally think AI is cool and AI stocks have a great future. But remember that thing I said about big corrections. Just because something will be awesome in 30 years does not make it a good buy now (Looking at you, Nasdaq 1999!).
Here's the stages.
SMCI
SMCI is tricky because when you look at the rally close up you can see there are 10% drops which could be considered fitting for stage 4. That would imply a top being in now we have the big break candle. However, it's also equally valid to make a case for this being stage 4 and there to be a final spike out.
The model would have SMCI either at a classic bull trap reversal level or due to spike the high before the real turn.
Click below for the case for high being in.
AAPL
Here's the phases in AAPL looking at from inception.
The usefulness of the model (So far) for AAPL can be supported with an accurate forecast of the rally to a new high forming.
All of which would be well explained with Elliot Wave theory.
Here's an example of what happens when all of these phases hit and there is a strong and complete reversal.

Short Cocoa at 10,000The cocoa market is in the mania phase.
Shorted at 10,000 in small size (2%), just one small position in the macro book, can only lose 2% even if it doubles in value from here!
Caveat emptor. Target much lower over coming months.

The pros look at 1300 candles or higher for their giant trendsHello everyone! Hope you are all well!
In PhiCube methodology, we study the relative behavior of fractals separated by a factor of 4.236 (Phi raised to the third power - Phi Cubed = PhiCube).
If we consider a single cande as the smallest technical entity on a chart,, we can begin to derive our fractals:
1 candle x 4.236 = 4 candles (rounded) (the baby)
4 candles x 4.236 = 17 candles (the teenager)
17 candles x 4.236 = 72 candles (the parent)
72 candles x 4.236 = 305 candles (the Sumo)
305 candles x 4.236 = 1292 candles (the Giant)
We need three fractals moving the in the same direction for a trend.
Any adjacent fractals moving in opposite directions is a consolidation of the larger fractal.
But, we NEVER look at more than 3 fractals, as the smallest 4th fractal is just noise in that scenario. (Think about it....the fourth fractal is 72 times smaller than the largest...less than 1.6%...it's just noise).
You novices want to understand why you're losing money with candlestick patterns? It's just noise.
If you want to ride a massive trrend, it needs a Sumo or a Giant behind it.
Cocoa futures is a perfect example.
Look for a bounce and a test of the highs whem price touches the 305 ema in blue.
It works on any ticker or timeframe. In future posts I will show you how to use this concept for massive downtrends.
Try it!
Take care,
Bo

Don't say you missed itI've been waiting for the trend to break and then backtest a resistance for a huge short. And I got it. After waiting for 7 months.


Cocoa Market Outlook. Is Cocoa the New Gold?In recent months, the price of cocoa has soared to record levels several times, while it has increased by more than 150% since the beginning of the year amid concerns about a reduction in supplies to West Africa.
Today, cocoa prices fluctuate, reaching heights and correcting to lower numbers due to a strengthened dollar. A week ago, cocoa futures priced at $11682 a ton, April's record.
The main reason behind the significant growth of not only cocoa but also other food commodities is that this year promises to be very dry and hot.
Cocoa is sold in futures, meaning the expectations of poor harvest directly influence the price. In the other areas, the cocoa harvest has also been falling, but because of above-average rainfall , there has been an increase in crop diseases due to heightened wetness.
In addition to the potential shortage of supplies, cocoa prices are also being pushed by investors' increasing interest in infusing funds into agricultural products. If we look at Bill Gates' portfolio, we will find that Bill Gates is now one of the largest landowners in the United States. Thus, the agricultural market becomes one of the hedging strategies.
How to invest in cocoa?
Investors who seek ways to invest in cocoa may find it interesting to buy ETFs on this product. For example, the iPath Bloomberg Cocoa Subindex Total Return ETN is one of the most well-known exchange-traded funds, exposing investors to the performance of the Bloomberg Cocoa Subindex Total Return. This index reflects the returns from a basket of cocoa futures contracts.
Furthermore, Invesco DB Agriculture Fund allocates approximately 28% of its portfolio to cocoa futures, also offering significant exposure to the cocoa market. It seeks to track the DBIQ Diversified Agriculture Index Excess Return, which includes various agricultural commodities futures contracts.
In my opinion, buying shares of chocolate manufacturers might not be a good idea. Chocolate manufacturers often aim to maintain stable prices for their products to retain market share and consumer loyalty. This means that when cocoa prices rise, manufacturers may absorb some of the cost rather than pass it onto consumers.
Cocoa investing obstacles for private investors
Private investors may also face some obstacles when buying cocoa or other food commodities. For example, acquiring cocoa futures on the Chicago Exchange may require not only profound knowledge, but also serious investments. As for cocoa ETFs, these instruments may also not be suitable for all investors due to their complexity and low liquidity.
Moreover, cocoa commodity cycles are actually quite long. Therefore, investors need to understand whether they seek short-term speculation or adopt a long-term investment strategy. For those opting for the latter, patience and readiness to hold positions for extended durations become imperative.
Thus, before making any investments, especially in singular commodities like cocoa or grains, it's crucial to consult a professional due to the risks involved. Diversification is key to investing; while assembling a portfolio of various products increases the likelihood of returns, focusing on particular commodities like cocoa or grain can pose threats.

$CCK2024 cocoa showing signs of exhaustionICEUS:CCK2024 Uhhh... Cocoa. The most it can rise to is $12,933.
I didn't read the article.
It is showing all signs of exhaustion. Volume is decreasing while the price is going parabolic. The oscillators are showing bearish divergence.
It is close to a pull back, if not out right crash to 8000 area.


ATH - COCOA FuturesCurrently Cocoa Futures trading in Strong bullish winter and will it rally further?


COCOA : A CORRECTION IS DUE- The market has been trading above a bullish trendline since mid-March ; The mid-term trend was then bullish
- More recently, the increased appetite for the US Dollar has started to put pressure on a wide range of commodities, including Cocoa.
Since the impact on 11,212, the control of the market has been taken over by sellers, leading prices back to their first support level around the 10,000 mark.
This pull-back following a bearish divergence with the RSI has driven the market to invalidate its mid-term bullish trend, opening the doors to a correction.
The RSI has also confirmed the bearish break-out, but remains in buying zone, slightly over the 50% level.
- The bullish trend has clearly been invalidated.
However, it is still hard to say whether the market consolidate laterally or register a deeper correction at this point.
Even if the 10,000 stays as the immediate support level for the market, 9,332 (38.2% Fibonacci + last market bottom) should be seen as a crucial zone.
If a break-out happens there, we could expect a deeper bearish movement towards 8,750 and 8,170 by extension.
Pierre Veyret, Technical Analyst at ActivTrades
The information provided does not constitute investment research. The material has no been prepared in accordance with the legal requirements designed to promote the independence of investment research and such is to be considered to be a marketing communication.
All information has been prepared by ActivTrades ("AT"). The information does not contain a record of AT's prices, or an offer of or solicitation for a transaction in any financial instrument. No representation or warranty is given as to the accuracy or completeness of this information.
Any material provided does not have regard to the specific investment objective and financial situation of any person who may receive it. Past performance is not reliable indicator of future performance. AT provides an execution-only service. Consequently, any person acing on the information provided does so at their own risk.
