A barrel at $130? Not unless Hormuz closes for good.As tensions in the Middle East between Iran, Israel and the United States escalate, speculation about a $130 oil barrel resurfaces on the markets. While the recent rise in prices is very real, fuelled by geopolitics, there is nothing in the fundamentals or in the technical analysis to justify such an extreme scenario for the time being. Unless... the Strait of Hormuz is blocked. Here are some explanations.
1) Oil rebounds, but no technical red alert
Since its low point in May, oil prices have surged by over 40%, buoyed by regional tensions and renewed volatility. The market is anticipating a rise in geopolitical risk, but for the time being, this recovery is not being accompanied by any technical red flags.
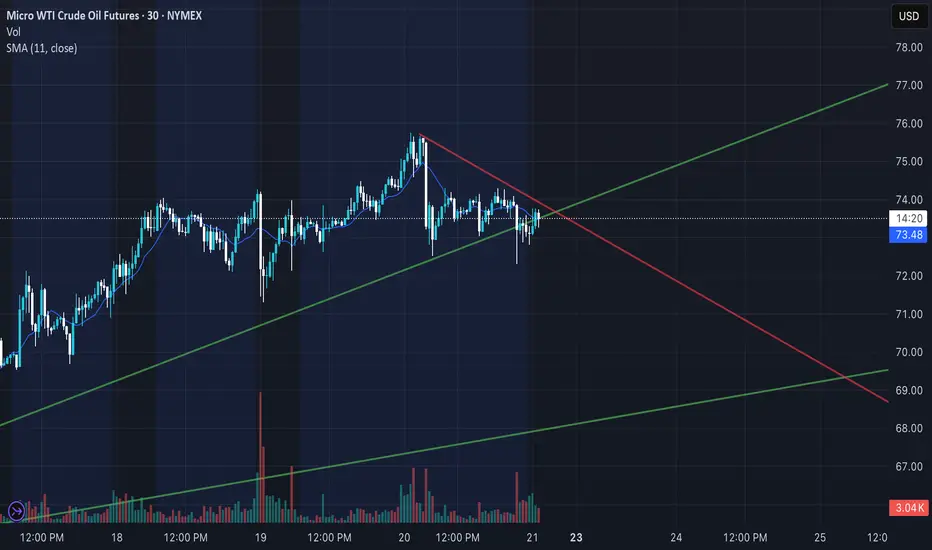
Indicators such as the COT report (Commitment of Traders), volumes and key technical thresholds on WTI and Brent are not confirming extreme tension at the current stage, as long as US oil remains below resistance at $80 a barrel. Although the 200-day moving average has been breached, and the reintegration of the $65 level has provided the starting point for a bullish impulse, the price of oil is now at a technical crossroads.
The chart below shows a bearish resistance line (red) on WTI, and the same applies to Brent. If these resistances were to be breached, this would be a strong bullish warning signal for the price of a barrel of oil towards $90/95.
2) A market under pressure... but framed by OPEC
Indeed, only a major supply constraint can push oil up to $130 a barrel.
The current geopolitical context comes at the worst possible time for OPEC. The oil cartel, led by Saudi Arabia, had recently decided to increase production after years of restrictions. The objectives were to respond to what was seen as robust demand, win back market share from US producers and punish less disciplined members.
In May, June and July, an increase of 411,000 barrels per day is scheduled. In other words, the market is receiving additional supply, which mechanically limits the risk of a speculative surge, barring a major exogenous shock such as the long-term closure of the Strait of Hormuz.
3) Iran/Israel/USA: the market prices the risk, but doesn't panic. Traders are currently considering three scenarios:
1. Tougher sanctions against Iran, reducing supply by 500,000 to 1 million barrels a day.
2. A targeted attack on Iran's oil infrastructure.
3. A temporary closure of the Strait of Hormuz.
The first two cases can be absorbed by the market, notably thanks to the production capacities of other OPEC+ members or the strategic release of reserves. On the other hand, blocking the Strait of Hormuz would be a “game changer”.
The Strait of Hormuz, between the Persian Gulf and the Gulf of Oman, is the gateway to 20% of the world's oil supply, i.e. some 17 to 18 million barrels a day. It is also a vital route for liquefied natural gas (LNG), particularly from Qatar.
Even a partial shutdown would have an immediate impact on all logistics chains and the energy security of importing countries, and would trigger a brutal price shock. In this case, oil at 130 dollars would no longer be an extreme hypothesis, but a plausible scenario in the very short term.
The situation is, of course, evolving, and investors need to keep an eye out for weak signals: military movements in the Strait, targeted attacks on energy infrastructures, bellicose rhetoric. In the absence of a blockade of Hormuz, the fundamentals (rising OPEC production, slowing Chinese demand, technical stability) militate in favor of a ceiling of around $80/90.
A barrel at $130? Yes, but only if Hormuz closes completely.
DISCLAIMER:
This content is intended for individuals who are familiar with financial markets and instruments and is for information purposes only. The presented idea (including market commentary, market data and observations) is not a work product of any research department of Swissquote or its affiliates. This material is intended to highlight market action and does not constitute investment, legal or tax advice. If you are a retail investor or lack experience in trading complex financial products, it is advisable to seek professional advice from licensed advisor before making any financial decisions.
This content is not intended to manipulate the market or encourage any specific financial behavior.
Swissquote makes no representation or warranty as to the quality, completeness, accuracy, comprehensiveness or non-infringement of such content. The views expressed are those of the consultant and are provided for educational purposes only. Any information provided relating to a product or market should not be construed as recommending an investment strategy or transaction. Past performance is not a guarantee of future results.
Swissquote and its employees and representatives shall in no event be held liable for any damages or losses arising directly or indirectly from decisions made on the basis of this content.
The use of any third-party brands or trademarks is for information only and does not imply endorsement by Swissquote, or that the trademark owner has authorised Swissquote to promote its products or services.
Swissquote is the marketing brand for the activities of Swissquote Bank Ltd (Switzerland) regulated by FINMA, Swissquote Capital Markets Limited regulated by CySEC (Cyprus), Swissquote Bank Europe SA (Luxembourg) regulated by the CSSF, Swissquote Ltd (UK) regulated by the FCA, Swissquote Financial Services (Malta) Ltd regulated by the Malta Financial Services Authority, Swissquote MEA Ltd. (UAE) regulated by the Dubai Financial Services Authority, Swissquote Pte Ltd (Singapore) regulated by the Monetary Authority of Singapore, Swissquote Asia Limited (Hong Kong) licensed by the Hong Kong Securities and Futures Commission (SFC) and Swissquote South Africa (Pty) Ltd supervised by the FSCA.
Products and services of Swissquote are only intended for those permitted to receive them under local law.
All investments carry a degree of risk. The risk of loss in trading or holding financial instruments can be substantial. The value of financial instruments, including but not limited to stocks, bonds, cryptocurrencies, and other assets, can fluctuate both upwards and downwards. There is a significant risk of financial loss when buying, selling, holding, staking, or investing in these instruments. SQBE makes no recommendations regarding any specific investment, transaction, or the use of any particular investment strategy.
CFDs are complex instruments and come with a high risk of losing money rapidly due to leverage. The vast majority of retail client accounts suffer capital losses when trading in CFDs. You should consider whether you understand how CFDs work and whether you can afford to take the high risk of losing your money.
Digital Assets are unregulated in most countries and consumer protection rules may not apply. As highly volatile speculative investments, Digital Assets are not suitable for investors without a high-risk tolerance. Make sure you understand each Digital Asset before you trade.
Cryptocurrencies are not considered legal tender in some jurisdictions and are subject to regulatory uncertainties.
The use of Internet-based systems can involve high risks, including, but not limited to, fraud, cyber-attacks, network and communication failures, as well as identity theft and phishing attacks related to crypto-assets.
WBS1! trade ideas

What Is the Base Price or Long-term Support for Crude Oil?What is the base price for oil? Specifically, today we will discuss crude oil, and we can apply this understanding to other commodities as well.
I won't go into too much technical detail about the difference between the base price and the cost price for crude oil, but for most people, it helps to see the title as “Is there a bottom-line price or support level for crude oil?”
My answer is yes, and this is due to inflation. Over time, we tend to pay higher prices for food, gas and many others that we consume.
The cost of goods varies between producers and merchants, and then from merchants to end consumers. However, it all starts with the producer. Before a producer acquires oil for refining, they reference crude oil prices as a benchmark to decide whether to make a purchase or hold back.
So, “Is there a bottom-line price or support level for crude oil?”
As we can see from the yearly chart, in every few years the base price of crude oil keeps adjusting higher; in levels and stages.
There is also this parallel channel formed by joining across its troughs and mirror it to its prominent resistance, we can observe crude oil prices range bound between this broad uptrend over time.
We can try to apply this analysis to other commodities; we will find a similar broad uptrend across most of them. But why? Because of inflation.
Regarding the bottom-line support for crude oil, we observed that it was at $10 from the 1980s until the turn of the millennium. Over time, accounting for inflation, this support level shifted upward to around $30 from the early 2000s until 2020, the year of COVID-19. And now we can see there is a new support at $60 since the start of 2020.
How to explain this break below $30 base price and went to -$40?
In technical analysis, this break is considered a false break, because, at the close of that year, on this yearly chart, prices settled above the support line at $30.
The story behind this is that when COVID hit, airlines were grounded, leading to storage issues for large quantities of oil. It cost more to store the oil than its selling price, which caused prices to drop below zero, reaching as low as -$40. But prices ultimately found its equilibrium and settle at a fair value at $48 that year.
Where is the support for crude oil, and what is its current direction?
This was a video analysis on Sep 2024, in this weekly chart, we can see a wedge pattern. Then I believe if the price breaks above this downtrend line, it suggests that we may see higher crude oil prices. And this analysis is taking shape today.
We can see prices initially broke above this trendline, but shortly sink below and broke this support line at $66 to $55. And today we are at $73 after the renewal of the Middle East tension.
How should I interpret the move to the recent low around $55?
I would encourage to always discover the development with different time frame as time progress.
Switching to the yearly chart, we observed that crude oil is still supported above $60 that year.
Please also make a point to adjust this downtrend line from time to time as market dynamic changes.
Watch the full video:
WTI Crude Oil Futures & Options
Ticker: MCL
Minimum fluctuation:
0.01 per barrel = $1.00
Disclaimer:
• What presented here is not a recommendation, please consult your licensed broker.
• Our mission is to create lateral thinking skills for every investor and trader, knowing when to take a calculated risk with market uncertainty and a bolder risk when opportunity arises.
CME Real-time Market Data help identify trading set-ups in real-time and express my market views. If you have futures in your trading portfolio, you can check out on CME Group data plans available that suit your trading needs www.tradingview.com
Trading the Micro: www.cmegroup.com
www.cmegroup.com

Missiles Flying! Buy OIL, GOLD! Sell the Stock Indices!In this Weekly Market Forecast, we will analyze the S&P 500, NASDAQ, DOW JONES, Gold and Silver futures, for the week of June 22-28th.
This is a revision of the Weekly Forecast I posted yesterday! With the latest US strikes into Iran nuke sites, the fundamentals go from zero to a hundred! Risk on turns immediately to risk off, and gap opens are likely to present themselves.
Look to long the safe havens and short the equities until tensions ease.
Enjoy!
May profits be upon you.
Leave any questions or comments in the comment section.
I appreciate any feedback from my viewers!
Like and/or subscribe if you want more accurate analysis.
Thank you so much!
Disclaimer:
I do not provide personal investment advice and I am not a qualified licensed investment advisor.
All information found here, including any ideas, opinions, views, predictions, forecasts, commentaries, suggestions, expressed or implied herein, are for informational, entertainment or educational purposes only and should not be construed as personal investment advice. While the information provided is believed to be accurate, it may include errors or inaccuracies.
I will not and cannot be held liable for any actions you take as a result of anything you read here.
Conduct your own due diligence, or consult a licensed financial advisor or broker before making any and all investment decisions. Any investments, trades, speculations, or decisions made on the basis of any information found on this channel, expressed or implied herein, are committed at your own risk, financial or otherwise.


#202525 - priceactiontds - weekly update - wti crude oilGood Day and I hope you are well.
comment: Many gaps on different time frames and I only marked the ones from the daily. Next targets above for the bulls are 80 and the 2023-09 high at 82.91. I think we can see a futures gap up above 81 and then another huge pullback. Supply shock for Oil is still not there or we would not see the market pull back that much. Given the current macro risk we can only expect higher prices but the swings are too wild for me tbh.
current market cycle: bull trend but trading range on 1h tf
key levels: 67 - 83
bull case: Bulls have all the arguments on their side. Their only issue is that we are still seeing 5-10% intraday swings to both sides and only if the pull backs become smaller and we leave gaps behind, can we go meaningful higher and stay there. We have two open gaps on the daily chart but market would have to stay above 70 now to confirm them. 77 is the next target for the bulls which would be a higher high above the 2024-04 high.
Invalidation is below 70 - if we drop below, we most likely continue sideways inside the big range until we maybe get another big breakout above
bear case: US bombs on Iran. Interesting to see if we stay below 77 and move sideways. I can not see it but I obviously did not saw the 11% pullback on Monday as well. That was insane. Best bears can hope for is to move sideways and continue with the deep pullbacks. Bears can also make big money on these wild swings, which is not something seen in strong bull trends.
Invalidation is above 77
short term: Bullish but too cautious to trade it. Future gap ups were sold heavily and market has not found acceptance above 73 for the entire week. Still expecting 77 to get hit and there is no reason why we can’t see 80$ on oil over next 2 weeks.
medium-long term - Update from 2025-06-22: No bigger opinion other than “don’t be a bear here”. No idea if market can sustain the buying and stay above 70 for longer or even 80 for that matter. Too many big risks which will move the market big time.

Why Oil Stays Bullish: Israel-Iran and the APMMCurrent geopolitical tensions between Israel and Iran have precipitated significant volatility in global oil markets. This study analyzes the immediate and medium-term impacts of the conflict on oil prices utilizing the Advanced Petroleum Market Model (APMM), a multifactorial fundamental analysis framework. The analysis reveals that both robust supply fundamentals and geopolitical risk premiums are currently supporting oil prices at elevated levels.
1. Introduction
Global energy markets are experiencing upward pressure from escalating tensions between Israel and Iran. Israeli military actions against Iranian targets have triggered immediate oil price responses, with Brent crude rising up to 10% and reaching the highest levels since January 2024 (Al Jazeera, 2024). The Strait of Hormuz, through which approximately 20% of global oil trade flows, remains central to geopolitical risk pricing in oil markets (CNBC, 2024).
2. Current APMM Market Assessment
The Advanced Petroleum Market Model currently indicates a Bullish (Weak) regime with a composite score of 69.1 and a rising trend. Supply indicators are bullish, inventory and demand are neutral. The model's adaptive status shows it is successfully adjusting to current market conditions.
3. Market and Model-Based Scenario Analysis
- Brent Crude: 5-7% increase to over $87/barrel
- WTI Crude: 6% daily gain
- Geopolitical Risk Premium: $8-12/barrel (Goldman Sachs, 2024)
The APMM's current reading suggests oil markets are in a "Fundamental Support Regime" reinforced by geopolitical risk premiums. Geopolitical uncertainty is inherently bullish for oil prices as it increases supply disruption risks and drives precautionary demand.
Scenario Probabilities
- Base Scenario (65%): Bullish (Weak) regime persists, prices stabilize at $75-85/barrel
- Escalation (25%): Strong Bullish regime, prices at $85-95/barrel
- Extreme (10%): Extreme Bullish regime, prices above $100/barrel
4. Long-term and Policy Implications
- Diversification: Importers seek alternatives to Middle Eastern oil
- Strategic Reserves: Governments reconsider reserve strategies
- Energy Transition: Geopolitical risks strengthen investments in renewables
5. Conclusion
Despite robust supply, oil prices are supported by both fundamentals and persistent geopolitical risk premiums. The APMM reflects this environment with a Bullish (Weak) signal and rising trend. Geopolitical uncertainty remains a key bullish factor for oil markets.
References
Al Jazeera. (2024). Oil prices spike as Israel strikes Iran amid Middle East tensions.
Armstrong Economics. (2024). Oil Prices & the Israel-Iran Crisis - A Historical Perspective.
BBC. (2024). Israel Iran: What could conflict mean for oil and gas prices?
Chen, S., Liu, P., & Wang, J. (2024). Uncertainty about interest rates and crude oil prices. Financial Innovation, 10(1), 1-28.
CNBC. (2024). Oil prices could spike to $95 if Iran-Israel conflict escalates, Goldman Sachs warns.
Goldman Sachs. (2024). Commodities Research: Middle East Risk Premium in Oil Markets.
Al-Shboul, M., & Alqaralleh, H. (2025). Dynamic Effects of Economic Uncertainties and Geopolitical Risks on Saudi Stock Market Returns. Journal of Risk and Financial Management, 18(1), 12.

HMMMCL1! Crude Oil Futures – 1D & 4H Technical Breakdown by GOAT
This chart presents a comprehensive multi-timeframe analysis of NYMEX Crude Oil Futures (CL1!), utilizing daily and 4-hour views to outline key technical levels, trend momentum, and potential trade setups.
🟤 Left Panel – CL1! Daily Chart (1D):
Macro Resistance Test: Price is retesting a major descending trendline from the 2022 highs, now acting as a key long-term resistance zone between 75.80–77.00.
Breakout Structure: A strong push from the $62.50 base has created a steep rally, with price entering a historically reactive supply zone.
Rejection Risk: Highlighted red box signals a high-probability reversal zone unless price confirms a clean breakout above trendline resistance.
RSI Observation: Daily RSI near overbought levels (~78), reflecting possible exhaustion and signaling caution for bulls.
🟠 Right Panel – CL1! Intraday Chart (4H):
EMA Structure: Price riding the 21/50/100 EMA cluster with trend confirmation—momentum remains bullish but flattening.
Channel & Pullback Setup: Short-term ascending trendline may act as a bounce point. Failure could shift price toward 71.30 or lower.
Divergence Watch: Bearish RSI divergence forming, suggesting weakening momentum on recent highs.
Trade Zone: Boxed region shows a potential long setup targeting the 75.80–77.00 area with a stop below 71.30, giving a clear R:R window.
📉 RSI Panels:
Daily RSI: Approaching historical overbought levels. Traders should watch for momentum reversal or confirmation through trend continuation.
4H RSI: Divergence vs price highs and loss of recent bullish slope could foreshadow a short-term correction.
🧠 Summary:
Crude oil is at a critical confluence zone, testing a macro trendline on the daily and showing slowing momentum intraday. Price action over the next few candles will likely determine whether we see a breakout continuation toward 80+ or a rejection back toward the mid-60s.
⚙️ Educational chart designed for technical traders – not financial advice.


$100 a barrel coming soon for Crude oil futures In this video we focus on the current accumulation in the oil chart and the prospect of higher prices ahead .
I highlight how the respect of the previous quinquennial pivots gave us a 45% move to the upside in the past 8 weeks .
Looking ahead on the monthly timeframe we have the following confluences above the current price of $75 .
Above the current pa we have the point of control at $ 88 and the avwap at $97, if we can reclaim the poc I think we will continue to push up to the fib levels that I have mentioned in the video.
In addition to the above we also have the decennial pivots at $107/$112 alongside the value area high .
All of this validates for me why oil will be pushing back up throughout the course of the year .
Tools used in the video
Tr pocket , pivots , fived range volume profile and fib expansion

MCL to $71.50Oil has just crossed a strong upwards trend line with 4 touch points indicating a move to the downside. Price target $71.50 in the short term.
Because of the situation in the middle east at the current moment, price has the potential to move back towards the previous swing high. If price closes above the opposite trend line I will cut all of my position.
WTI(20250620)Today's AnalysisMarket news:
The Bank of England kept interest rates unchanged at 4.25%, and the voting ratio showed that internal differences were increasing. Traders expect the bank to cut interest rates by another 50 basis points this year.
Technical analysis:
Today's buying and selling boundaries:
74.33
Support and resistance levels:
77.40
76.25
75.51
73.15
72.40
71.26
Trading strategy:
If it breaks through 73.15, consider buying, and the first target price is 75.00
If it breaks through 72.40, consider selling, and the first target price is 71.26

Crude oil------Buy around 74.00, target 75.00-76.50Crude oil market analysis:
Crude oil has been strong recently, and it is also because of the support of fundamentals and inventory data that crude oil has begun to strengthen. Today's idea is still bullish on crude oil. Continue to buy after the retracement. The daily moving average has begun to diverge. The small support for buying has reached around 72.00. The suppression position is around 74.00 and 77.60. I estimate that it will form a small shock and then break through and rise again. If it does not break 70.00, it is still strong. Buy crude oil around 74.00 today.
Fundamental analysis:
The interest rate results announced by the Federal Reserve last night remained unchanged at 4.25%-4.50%, and the fourth consecutive meeting remained unchanged, which was in line with market expectations. The uncertainty of the United States about the future has led to no major changes in monetary policy in the near future.
Operational suggestions
Crude oil------Buy around 74.00, target 75.00-76.50

Crude Oil Pushing Into Supply Zone — Watching for Breakout or ReCrude Oil (CL) has been trending strongly bullish today — price is now testing the red supply zone overhead.
I am watching very closely:
✅ If buyers can break this zone with strong momentum, I will look for a breakout continuation trade to ride the trend higher.
✅ If buyers get trapped and order flow shifts bearish inside this zone, I will look for a short opportunity targeting the green demand zone below.
Important: I always study buyer and seller behavior inside the zones first — no blind trades! I also use order flow tools to catch traps and spot aggressive traders on the wrong side of the move.
Patience first — waiting for the zone to tell me what to do. ✅

Geopolitical Oil Shocks May Be Short-Lived and Prices May Fall
Crude oil prices are climbing by over 1% today across both Brent and West Texas Intermediate, approaching their highest levels since January.
These gains are driven by rising concerns over the fallout from a potential escalation in the Israel–Iran war, especially with the prospect of direct U.S. military involvement that could widen the conflict and threaten oil supplies from the Middle East.
Talks are intensifying around a possible U.S. strategic bomber strike on Iran’s Fordow uranium enrichment facility. Such a move would mark a dangerous new phase of escalation, raising the risk of supply disruptions from key oil-exporting countries via the Strait of Hormuz or the Bab el-Mandeb Strait, according to several analysts and opinion columnists . Iran’s major oil export facilities may also be pulled into the conflict sooner rather than later.
Any attack on these energy assets could trigger a price shock that sends oil soaring toward $130 per barrel, according to estimates from JPMorgan .
The first step toward this new phase of escalation may not be far off, as former President Trump appears unshaken by potential consequences—the include regional instability to possible retaliatory attacks on U.S. and allied interests abroad. According to Axios , he is doubtful about the effectiveness of the bunker-busting bombs intended for a Fordow strike.
Even without such a strike, a prolonged conflict with little hope for a diplomatic resolution would likely increase the vulnerability of global oil flows, as reported by the Wall Street Journal earlier this week. However, such disruptions are expected to remain short-term, in my opinion.
In the longer run, this war is unlikely to be sustainable in its current form. Israel is reportedly facing a dwindling supply of interceptor missiles, with reserves potentially lasting just 12 more days at the current rate of Iranian rocket fire, according to experts cited by The Washington Post . The Journal also quoted a U.S. official who mentioned a decline in Israel’s supply of Arrow missiles used to intercept ballistic threats.
In my view, Israel will likely avoid reaching such a tipping point unless it achieves a decisive turning point in the conflict, whether through sidelining U.S. involvement or toppling Iran’s regime. If neither is achieved, Israel may resort to targeting Iran’s oil and gas export infrastructure to enforce a surrender. This action that could send oil prices into shock in the coming days. A drawn-out war in its current form is unsustainable for either side.
Still, a diplomatic solution is not entirely off the table. A senior Iranian foreign ministry official told the New York Times that Tehran may accept Trump’s offer to meet soon for a potential ceasefire discussion. Such developments could reduce the geopolitical risk premium priced into oil and potentially push U.S. crude back below $70 per barrel.
In any case, I believe any shock to oil prices would likely be temporary, as major producers are generally capable of offsetting short-term supply disruptions unless we enter into extreme scenarios, as noted by the Wall Street Journal’s Editorial Board earlier this week.
On another front, oil prices are also under increasing pressure from concerns around prolonged monetary tightening by the Federal Reserve. Jerome Powell’s speech yesterday disappointed markets, striking a more hawkish and cautious tone than before on interest rate cuts.
Policymakers have grown increasingly wary of inflation risks, particularly with the renewed trade war and rising geopolitical tensions, which could potentially push inflation above 3 percent again.
Such extended tightening could weigh further on economic growth or even trigger a recession, dragging down oil demand and keeping prices on a downward trajectory.
Monetary tightening risks also overlap with persistent negative signals from China. Despite improvements in retail sales and declining unemployment, both industrial production and fixed-asset investment slowed unexpectedly in May. Goldman Sachs also expects continued weakness in China’s housing market, which could remain at just a quarter of its 2017 peak level for years to come.
Should trade negotiations between the U.S. and China fail, both economies and oil prices could face further downward pressure.
Samer Hasn

WTI(20250619)Today's AnalysisMarket news:
Fed's June meeting - kept interest rates unchanged for the fourth time in a row, and the dot plot showed two rate cuts this year, but the number of officials who expected no rate cuts this year rose to 7, and the rate cut expectations for next year were cut to 1. Powell continued to call for uncertainty, and the current economic situation is suitable for waiting and watching. He also expects tariff-driven inflation to rise in the coming months.
Technical analysis:
Today's buying and selling boundaries:
72.69
Support and resistance levels:
75.60
74.51
73.81
71.58
70.88
69.79
Trading strategy:
Upward breakthrough of 73.81, consider entering the market to buy, the first target price is 74.51
Downward breakthrough of 72.69, consider entering the market to sell, the first target price is 71.58
What Is the Base Price for Oil?What is the base price for oil? Specifically, today we will discuss crude oil, and we can apply this understanding to other commodities as well.
I won't go into too much technical detail about the difference between the base price and the cost price for crude oil, but for most people, it helps to see the title as “Is there a bottom-line price or support level for crude oil?”
My answer is yes, and this is due to inflation. Over time, we tend to pay higher prices for food, gas and many others that we consume.
WTI Crude Oil Futures & Options
Ticker: MCL
Minimum fluctuation:
0.01 per barrel = $1.00
Disclaimer:
• What presented here is not a recommendation, please consult your licensed broker.
• Our mission is to create lateral thinking skills for every investor and trader, knowing when to take a calculated risk with market uncertainty and a bolder risk when opportunity arises.
CME Real-time Market Data help identify trading set-ups in real-time and express my market views. If you have futures in your trading portfolio, you can check out on CME Group data plans available that suit your trading needs www.tradingview.com
Trading the Micro: www.cmegroup.com
www.cmegroup.com

Crude oil---Buy near 72.00, target 72.90-74.90Oil market analysis:
Recently, the daily crude oil line has started to pull up, and buying has begun to rise. The retracement is our opportunity to buy again. The moving average support of the daily crude oil line has begun to move up, and the pattern has reached around 69.60. Today's idea is to buy at 72.00. The pattern is difficult to see, just buy repeatedly. The fight between Iran and Israel is a great support for crude oil. In addition, there is EIA crude oil inventory data today.
Fundamental analysis:
Previously, we have been paying attention to geopolitical factors in the fundamentals. Indeed, the situation in the Middle East has also changed the way of gold and crude oil. Today we focus on the monetary policy of the Federal Reserve, and Chairman Powell's speech during the US trading time.
Operational suggestions:
Crude oil---Buy near 72.00, target 72.90-74.90

Crude Oil Futures: Navigating Geopolitical Risk and VolatilityMarket Context:
NYMEX:CL1! COMEX:GC1! CBOT:ZN1! CME_MINI:ES1! CME_MINI:NQ1! CME:6E1!
Implied volatility (IV) in the front weeks (1W and 2W) is elevated, and the futures curve is in steep backwardation. This indicates heightened short-term uncertainty tied to geopolitical tensions, particularly in the Middle East involving Iran and Israel. The forward curve, however, suggests the market is not fully pricing in sustained or escalating conflict.
We evaluate three possible geopolitical scenarios and their implications for the Crude Oil Futures market:
Scenario 1: Ceasefire Within 1–2 Weeks
• Market Implication: Short-term geopolitical premium deflates.
• Strategy: Short front-month / Long deferred-month crude oil calendar spread.
o This position benefits from a reversion in front-month prices once the risk premium collapses, while deferred months—already pricing more stable conditions—remain anchored.
o Risk: If the ceasefire fails to materialize within this narrow window, front-month prices could spike further, causing losses.
Scenario 2: Prolonged War of Attrition (No Ceasefire, Ongoing Missile and Air War)
• Market Implication: Front-end volatility may ease slightly but remain elevated; deferred contracts may begin to price in more geopolitical risk.
• Strategy: Long back-month crude oil futures.
o The market is currently underpricing forward-looking risk premiums. A persistent conflict, even without full-scale escalation, may eventually force the market to adjust deferred pricing upward.
o Risk: Time decay and roll costs. Requires a longer holding horizon and conviction that the situation remains unresolved and volatile.
Scenario 3: Full-Scale Regional War
• Market Implication: Severe market dislocation, illiquidity, potential for capital flight, and broad-based risk-off sentiment across global assets.
• Strategy: Avoid initiating directional exposure in crude. Focus on risk management and capital preservation.
o In this tail-risk scenario, crude oil could spike sharply, but slippage, execution risk, and potential exchange halts or liquidity freezes make it unsuitable for new exposure.
o Alternative Focus: Allocate to volatility strategies, defensive hedging (e.g., long Gold, long VIX futures), and cash equivalents.
o Risk: Sudden market shutdowns or gaps may make exit strategies difficult to execute.
Broader Portfolio Considerations
Given the crude oil dynamics, there are knock-on effects across other markets:
• Gold Futures: Flight-to-safety bid in Scenarios 2 and 3. Long positioning in Gold (spot or near-month futures) with defined stop-loss levels is prudent as a hedge.
• Equity Index Futures (E-mini Nasdaq 100 / S&P 500): Vulnerable to risk-off flows in Scenarios 2 and 3. Consider long volatility (VIX calls or long VX futures) or equity index puts as portfolio hedges. In Scenario 1, equities could rally on resolution optimism—especially growth-heavy Nasdaq.
• Currency Futures: USD likely to strengthen as a safe haven in Scenarios 2 and 3. Consider long positions in Dollar and Short 6E futures.
• Bond Futures: Risk-off flows theoretically should support Treasuries in Scenarios 2 and 3. Long positions in 10Y or 30Y Treasury futures could serve as a defensive allocation. Yields may retrace sharply lower if escalation intensifies. However, given the current paradigm shift with elevated yields, higher for longer rates and long end remaining high, we would not bet too heavily on Bond futures to act as safe haven. Instead, inflows in Gold, strengthening of Chinese Yuan and Bitcoin will be key to monitor here.
Scenario-based planning is essential when markets are pricing geopolitical risk in a non-linear fashion. Crude oil currently reflects a consensus expectation of de-escalation (Scenario 1), which opens the door for relative value and mean-reversion strategies in the front-end of the curve.
However, given the asymmetric risks in Scenarios 2 and 3, prudent exposure management, optionality-based hedges, and a flexible risk framework are imperative. A diversified playbook; leveraging volatility structures, calendar spreads, and cross-asset hedges offers the best path to opportunity while managing downside risk.

WTI(20250618)Today's AnalysisMarket news:
World Gold Council: 95% of central banks expect gold reserves to rise in the next 12 months.
Technical analysis:
Today's buying and selling boundaries:
72.29
Support and resistance levels:
76.53
74.95
73.92
70.66
69.63
68.04
Trading strategy:
If the price breaks through 73.92, consider buying, the first target price is 74.95
If the price breaks through 72.29, consider selling, the first target price is 70.66


WADZ & the Petrodollar RevivalGlobal FX Shift: The Rise of WADZ (2025–2026)
In mid-2025, a war between Iran and Israel spirals fast. Iran strikes hard, Israel’s defenses go offline from cyberattacks, and the U.S. surprisingly doesn’t intervene.
Instead, America steps in quietly, setting up a “peacekeeping” zone along the Jordan-Israel border. It’s called the West Asia Demilitarized Zone (WADZ) — but behind the scenes, it’s about control, not peace.
Oil jumps to $115.
Markets flip. USD/JPY and USD/TRY spike. EUR/USD slides.
Then the U.S. launches WZ-Digital, a USD-backed oil coin. Now, all oil in the region trades through America.
OPEC fractures. Saudi and UAE fall in line.
China gets iced out. USD/CNY shoots past 8.30.
In the desert, a secret U.S. city appears: The Watchtower — a hub that manages oil, data, and borders.
Regional FX Snapshot (2026)
Europe: Gas crisis deepens. EUR/USD drops to 0.95. East Europe leans on U.S.
China: Crypto-oil push fails. Capital flight triggers USD/CNY → 8.80.
Russia: Oil-for-yuan helps short-term, but ruble stays shaky.
Africa: Egypt & Morocco adopt WZ-Digital. Local currencies stay weak.
Southeast Asia: Dual oil trade (USD/WZ). SGD steady, MYR & IDR choppy.
(BRICKS+)
Latin America: Brazil, Argentina resist — then cave. USD demand surges.
Bottom Line:
By end of 2026, USD isn’t just money — it’s a global system.
WADZ quietly reprograms the rules of energy and trade.
No invasion, no headlines. Just quiet, total control.
Bye guys

Crude oil----Buy around 71.00-72.00, target 73.00-77.00Crude oil market analysis:
Last week's crude oil was very exaggerated because it broke the super suppression of 65.00 on the daily line. Once this position was broken, crude oil began to be standard. This is also the result of our many predictions of the cycle. Crude oil purchases will continue to soar this week. In addition, the escalation of the situation in the Middle East will make it difficult for crude oil to fall in the short term. I estimate that there is a possibility of repair. The retracement during the repair is our opportunity to buy again. In addition, the delivery period of crude oil futures contracts will also cause it to fluctuate violently again.
Fundamental analysis:
There are many fundamental analyses and data recently. Geopolitical factors are the main reason for its violent fluctuations. In addition, there is a holiday in the United States this week, and there is also a Federal Reserve interest rate result.
Operation suggestions:
Crude oil----Buy around 71.00-72.00, target 73.00-77.00
