SDX1! trade ideas
DXY - Dollar Index - Potenzial New Long phase
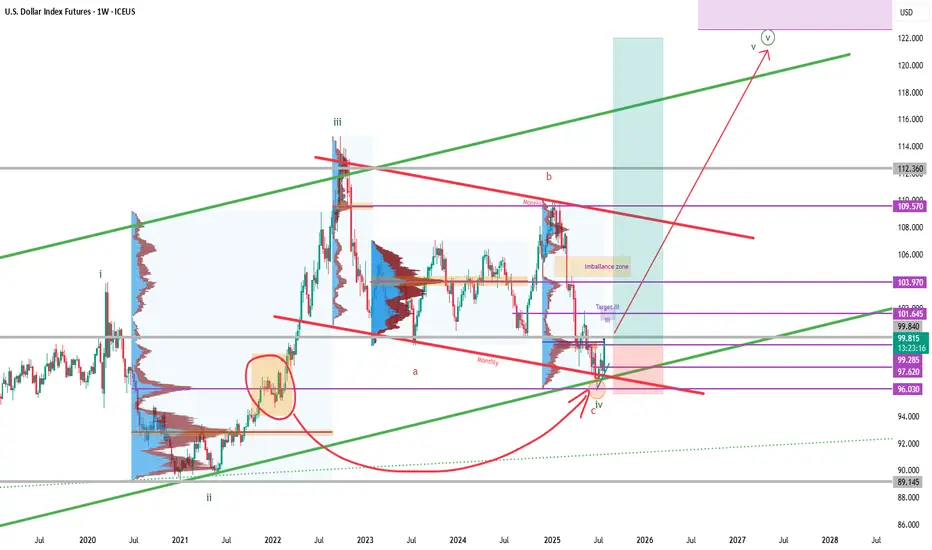
As we see in the chart .. in 2022 december we had a big volume accumulation before the october 2022 top to 112
After that we had a rebound and a laterality from sep. 22 to july 25.
In this moment we touche this volume and from my point of view we completed an ABC pattern.
Probably we have completed the pattern with a final Impulsive wave C and in this moment we start the final LONG wave 5
US DOLLAR BREAKS ABOVE RESISTANCE 98.99 BOTTOM CONFIRMED! Hey Traders so today looking at the US Dollar and as of today there is now a 123 bottom on the charts that has been confirmed by breaking above the 2 point.
Sees like fundamentally the US Dollar has now become bullish so with this breakout now confirmed does this mean we are in the beginning of Bull Market for the USD?
Well no one knows for sure but without any interest rate cuts and lots of tarriffs coming through it seems to be that way. Only time will tell of course if this becomes a new uptrend in USD so now we have a breakout whats next?
The way you trade the 123 bottom is wait for the market to break above the 2 point. Then alot of times there will be a retest of that zone at 98.89
Watch for the retest then consider selling Euro, Pound, Cad, Australian, Gold, Commodities etc...
Against the USD.
If you however you are bearish USD I would wait until market has daily close under 3 point that way you know for sure market has turned.
I will now start to include COT Report in my Analysis so we can see institutional positioning.
Currently Large Specs are Short the USD.
Good Luck & Always use Risk Management!
(Just in we are wrong in our analysis most experts recommend never to risk more than 2% of your account equity on any given trade.)
Hope This Helps Your Trading 😃
Clifford

Dollar Index - Expecting Bullish Continuation In The Short TermH4 - Strong bullish momentum followed by a pullback.
No opposite signs.
Until the two Fibonacci support zones hold I expect the price to move higher further.
If you enjoy this idea, don’t forget to LIKE 👍, FOLLOW ✅, SHARE 🙌, and COMMENT ✍! Drop your thoughts and charts below to keep the discussion going. Your support helps keep this content free and reach more people! 🚀
--------------------------------------------------------------------------------------------------------------------

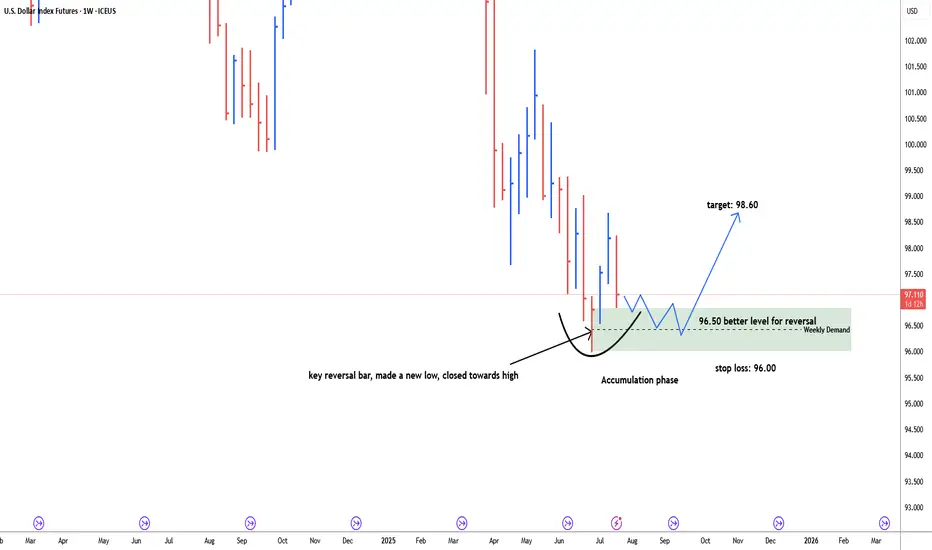
USD Dollar index possbile bullish reversal#usddollarindex, last weekly bar of the month of June is key reversal bar, made a new low and closed towards high. price retracing back down to test weekly demand zone. discount zone of demand is 96.50. possible bullish reversal target: 98.60. Stop loss below 96.00. price need time to build energy for bullish momentum. 96.50-96.00 is more secure level for long.
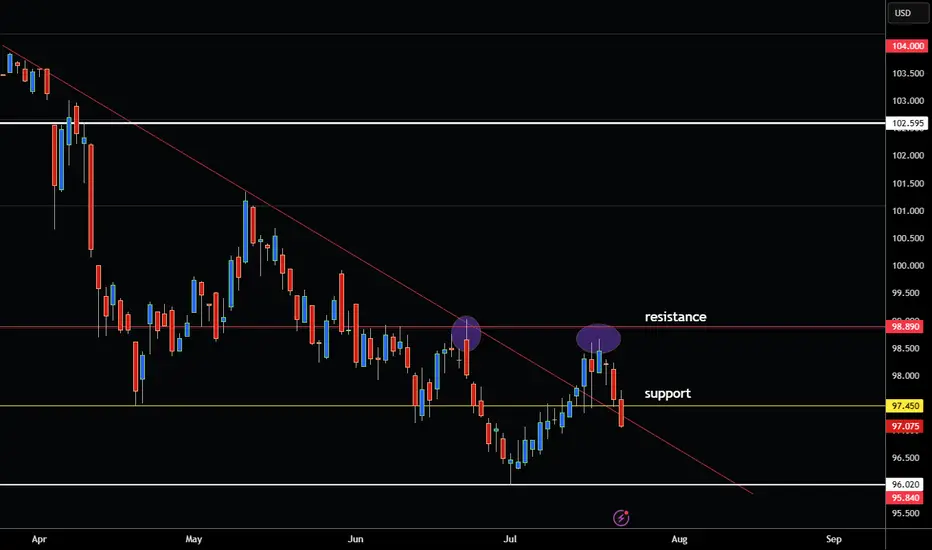
US DOLLAR INDEX BREAKING BELOW SUPPORT LEVEL RE-ENTER DOWNTREND! Hey Traders so today looking at the US Dollar Index or DX Market we can see that it has been in a solid downtrend since March. This is why alot of commodities and currencies have been getting stronger against it.
This is why I feel you don't need indicators to trade because price action shows you almost everything you need to be successful. A simple trendline and support and resistance is all you need to imo to see the story the market is trying to tell.
I'm not saying it's the holy grail of trading no one has a crystal ball we are all taking educated bets or guesses on where the market will go.
But most of the time it works! Key word there (most of the time)😁
Ok enough humor for today so getting down to it.
Now we see it is breaking below which is 97.45 from back in April. Also notice that 98.89 that got rejected twice once in June again last week. If market can get a daily close today below 97.45 this shows me that US Dollar Trend is still down. Now that it has re-entered under the downtrend line I would looks to sell rallies or buy markets against USD. Euro,Pound,Aussie,Gold, Commodities etc...
However if bullish USD I would wait for market to close above 98.89. That way you have true confirmation that the market wants to break higher because it will have formed a bottom formation!
Good Luck & Always use Risk Management!
(Just in we are wrong in our analysis most experts recommend never to risk more than 2% of your account equity on any given trade.)
Hope This Helps Your Trading 😃
Clifford
Dollar Outlook – Bearish Trend with Key Support Levels AheadThe market is clearly bearish, and I do not recommend buying the dollar at the moment.
If the price breaks through the important zone between 98.525 and 96.725, we could see a move down toward the next zone between 95.935 and 94.790.
This lower zone is a key support level if it gets broken, the dollar could face a very difficult situation.

DOLLAR HIT LARGE DEMANDWe may hit the end of the bend. On the larger time frame, we see price retest the double bottom neckline. Last month price developed a doji a huge sign that price might be heading in the opposite direction soon. Fundamentally we see Smart money adding to their contracts and the candles are shortening. Its safe to say that most pairs on the correlated side of the dollar that we can hold our sells until we see price action give us the sign to get out.

Currency Pairs. Part 2. Weekly OutlookExpecting massive expansion on DXY and major meltdown on Euro and Pound

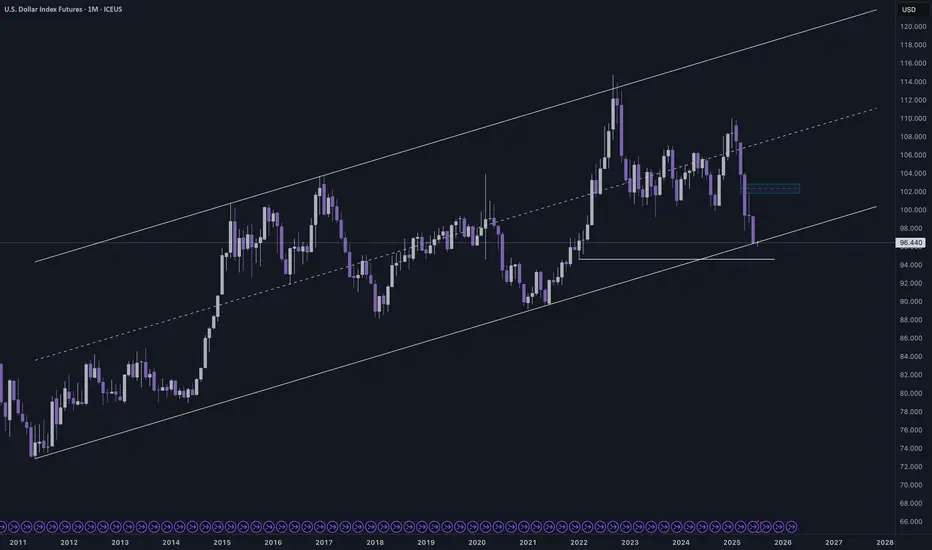
DX - USD Index Longterm Outlook Indicates Further DeclineThis long-term chart shows how the USD Index is trading within the boundaries of the Median Line set.
We see the lower extreme, solid support around the Center Line, and the upper extreme acting as resistance.
What’s next?
Well—if it’s not heading higher, it’s likely heading lower—and the rejection at the Upper Median Line (U-MLH) supports that view.
If we revisit the Center Line, my experience tells me it won’t hold—we’ll break through and head even lower.
Buckle up. It’s going to be a rough ride.

A Contrarian View On the US DollarI don't recall the last bullish headline I saw for the US dollar, bearish sentiment may be stretched, and I'm seeing plenty of clues across the US dollar index and all FX majors that we could at least be looking at a minor bounce. Whether it can turn into a larger short-covering rally is likely down to Trump's trade deals. Either way, I'm, on guard for an inflection point for the dollar.
Matt Simpson, Market Analyst at City Index and Forex.com

Is the US Dollar about to Rally?Hey traders just saw 3 bar trend line confirmed on US Dollar Index but is it actually entering a new uptrend?
Not sure no one knows of course fundamentally speaking I'm not sure. Seasonally it normally tops in the summer. But of course anything is possible in this new Tariff driven market we are in. But as you can see this is how you can get in when a trend changes early just find 3 bars and draw a straight line to connect them and you will be close to being on the right side of the market.
So if your bullish be careful and use risk management.
But if you bearish don't short until it goes back under the downtrend line imo.
Enjoy!
Clifford

Market Analysis For DXY: Week of May 26thFurther downside momentum looks like a strong possibility this week with liquidity and imbalances resting in short-term zones.

Market Analysis For DXY: Week of May 19thThe DXY has an interesting weekly chart with some key levels that could support further bearish price action.

Look To Sell USD and Buy EUR, GBP, NZD and AUD!This is the FOREX outlook for the week of May 5 - 9th.
In this video, we will analyze the following FX markets:
USD Index
EUR
GBP
AUD
NZD
CAD
CHF
JPY
USD Index has tapped the W -FVG. I expect it to sweep the last week's high before heading down. Short term strength for longer term weakness.
Look to buy xxxUSD pairs. Sell USDxxx pairs.
Wait for valid setups. FOMC is Wednesday! Don't just jump into trades without confirming the bias first!
Enjoy!
May profits be upon you.
Leave any questions or comments in the comment section.
I appreciate any feedback from my viewers!
Like and/or subscribe if you want more accurate analysis.
Thank you so much!
Disclaimer:
I do not provide personal investment advice and I am not a qualified licensed investment advisor.
All information found here, including any ideas, opinions, views, predictions, forecasts, commentaries, suggestions, expressed or implied herein, are for informational, entertainment or educational purposes only and should not be construed as personal investment advice. While the information provided is believed to be accurate, it may include errors or inaccuracies.
I will not and cannot be held liable for any actions you take as a result of anything you read here.
Conduct your own due diligence, or consult a licensed financial advisor or broker before making any and all investment decisions. Any investments, trades, speculations, or decisions made on the basis of any information found on this channel, expressed or implied herein, are committed at your own risk, financial or otherwise.

DXY Struggles at Mid-Cycle: Capital Flow Rotation Underway
The US Dollar Index (DXY) is sitting at a generational pivot zone around the 100 level, a midpoint in its 10-year price cycle. It has failed to reclaim this level decisively, and macro headwinds continue to build:
The re-escalation of tariff wars by the US administration, alienating global partners
Increasing capital outflows to the Yen, Gold, and emerging crypto ETFs
The risk of a flattening or inverted yield curve dragging confidence in USD-denominated debt
A break below 98.52 could accelerate the move toward 96.20, 94.76, and 92.44, historically associated with market stress and recessionary periods.
As the dollar's reputation as the world's safe haven erodes, Bitcoin—particularly in its regulated, ETF-wrapped form—is gaining favour as a neutral store of value.

DXY The Fake Dance- One of the most important barometers for global currencies and markets in the world.
- Most of the time DXY is a well used machine to supress markets (forex, stocks, cryptos, etc..)
- When they don't start the printing machine, DXY keeps is strength.
- When they start to print DXY starts to dip and markets boom up.
- it's really basic and based on "BRRR Machine".
- i had a hard time to decrypt this fake peace of resilience.
- actually there's none visible divergences on the 1M or 3M Timeframes.
- So i decided to push my analysis to 6M Timeframe and noticed few things :
- You can notice that from 2008 ( Post crises ), DXY was in a perma bullish trend.
- So now check MACD and will notice this fake move on January 2021 ( in graph the red ? )
- MACD was about to cross down, columns smaller and smaller, then a Pump from nowhere lol.
- i rarely saw that in my trading life on a 6M Timeframe.
- So to understand more this trend, i used ADX (Average Directional Index)
- ADX is used to determine when the price is trending strongly.
- In many cases, it is the ultimate trend indicator.
- So if you look well ADX columns, you will notice that a strong divergence is on the way.
- First check the Yellow Doted Line in July 2022 when DXY reached 115ish and look the size of the green columns.
- Now check today (red doted Line), and look again the ADX green columns is higher, but DXY diped to 105ish.
- So like always, i can be wrong, but i bet on a fast DXY dip soon or later.
- it's possible to fake pumps, but it's harder to fake traders.
Happy Tr4Ding !

Dollar Index Futures - Support LevelsHere's a longer term view of teh dollar index. Yes, it can go down a lot further.

US Dollar at Breaking Point: China Tariff Clash Risks Collapse Farmers, Boeing, and tech sectors brace for severe damage as USD threatens to break critical 10-year support amid escalating trade tensions.
Technical Breakdown: Crucial USD Zone Under Threat
The US Dollar Index (DXY) currently sits precariously within a critical 10-year support and resistance zone between 100 and 98. Historically, this key price area has repeatedly served as a midpoint equilibrium, dictating significant directional shifts. A decisive breach below this support could unleash substantial downward momentum, targeting deeper psychological and technical levels at 95 or potentially 92.
Examining a 10-year price cycle reveals a consistent pattern: whenever the USD has broken below this midpoint zone, it has lingered and struggled to regain upward traction. Currently, the short-term reprieve provided by the temporary 90-day tariff halt may offer brief support—but the underlying macroeconomic stress signals growing vulnerability.
Fundamental Factors: Tariff War's Long-Term Damage
While the US administration's aggressive tariff strategy against China was intended to protect American industries, its effects are increasingly backfiring—posing significant long-term risks to the US dollar and economy.
Agriculture:
US farmers are already suffering substantial losses. China, a critical export destination for American meat, grain, and soybeans, has drastically reduced purchases in retaliation. The direct result is declining farm revenues, increased inventory buildup, and weakening regional economies dependent on agricultural exports.
Aviation (Boeing):
One of America's largest manufacturing exporters, Boeing has become a recent casualty. Tariff escalations and strained diplomatic relations have severely affected aircraft sales to China—its biggest overseas market. With Boeing's market dominance already challenged by competitors like Airbus, prolonged tariffs could have dire financial implications, further pressuring USD sentiment.
Technology and Semiconductor Industries:
The US tech sector, including semiconductor giants such as Intel, Nvidia, Qualcomm, and Apple, heavily relies on Chinese manufacturing and consumption markets. Tariffs imposed on Chinese components and retaliatory measures have led to significant supply chain disruptions, increased production costs, and lower profit margins. Extended trade tensions risk permanently damaging these companies' competitiveness and earnings potential.
Retail and Consumer Goods:
American retailers, from Walmart to Amazon, are also exposed to China's tariff retaliation. Rising import costs translate directly into higher consumer prices, diminished purchasing power, and potential slowdowns in consumer spending—key pillars underpinning US economic growth and, by extension, dollar strength.
Why the Dollar Could Sink Further
As these vital sectors face prolonged pressure, broader economic fundamentals weaken. Reduced export revenues, rising domestic costs, and declining consumer confidence collectively undermine investor sentiment toward the US dollar. Moreover, sustained trade tensions might force the Federal Reserve into more accommodative monetary policies, potentially leading to rate cuts—a scenario traditionally bearish for the USD.
If the current trajectory persists, the US dollar could face intensified selling pressure, propelling it towards critical psychological and historical support levels at 95, with an even deeper potential retreat toward 92.
Bottom Line
The dollar now stands at a pivotal crossroads. With crucial sectors like agriculture, aviation, technology, and retail deeply vulnerable to prolonged US-China trade conflict, a fall below the critical 10-year support at 98 would signal a significant bearish shift. Investors and policymakers alike must brace for volatility as the implications of this trade war continue to unfold.

How low Can the Dollar Go? And What It Could Mean for EUR/USDThe US dollar index has handed back all of its Q4 gains with traders betting that Trump's trade war will do more damage than good to the US economy. I update my levels on the US dollar index and EUR/USD charts then wrap up market exposure to USD index futures.

DXY Analysis For Week Of April 14th, 2025Expecting a possible bullish week as we look to mitigate some upside zone before inevitably coming back down aggressively.

DXY Analysis For The Week Of April 7th, 2025After a very bearish week and a strong bullish reaction to end it, I would expect some premium points of interest to get filled before another aggressive move down.

Dollar Index Analysis Follow-UpIn this video, I revisit the analysis I sent out to traders at the beginning of the week, discussing the higher probability price action of the dollar index.
