is the fomc about to make a drastic liquidity mistakeall relates to interest differentials and the cross currents of the need to print before the clock runs out. as we've seen china is loosing control of the currency. when their currency weakens their peg partners strengthen... that being said when you weaken your currency you import inflation, however you export deflation. if we dont make drastic moves to weaken in a material matter we may see the dollar make a major run due to its scarcity. this end game is likely to result in a break up in the sino-american debt loop. lets just hope our ppl make material measures to lean dovish/expand the money supply
SDX1! trade ideas
king dollar going turbo.. china about to devalue again?turbo-tastic.. some traditional pairs may decouple. precious metals in particular will follow face value of bond rates rather the path of the dollar
USD 100 INDEX W1BUTTEFLY FORM ON USD100 INDEX (USDX) W1 CHART .. ENTRY... 98... SL...98.50... TP... 95.34

the fed needs to print.fed funds vs ioer vs 10 year. year theyre gonna have to print not because they want to because they have to longer term to regain control over the dollar...

futures 2020I have been pretty dead on with the futures chart. Have made a bundle of cash with #capitulation . Cant wait to see what end of July brings.
FYI- todays #puts were a huge seller and #calls leveled out at 12 % only

dx1usd is in consolidation mode and looks to pop for the month of July. Get ready with $aapl $tsla and $fang calls. Watch your stops.. We should hit $spx to 3k by July 12. Maybe Independence day gift.
hooorah!

Breakout on the DX1!Last post: April 14th 2019. See chart.
Review: Price was bullish but trading in consolidation.
Update: Price has now broken out of consolidation suggesting a bull trend continuation.
Conclusion: We do not trade this but look at this a guide to trading the USD pairs. If price continues towards 100, then we will look to place trades on the best looking USD pairs.
Sublime Trading

DXY seasonality forecastImplying flat- down future movement.
Candlesticks are shooting up. Short term bullish

Dollar Index Bullish but in ConsolidationLast post: June 16th 2018. See chart .
Review: Price was faced with the weekly 200SMA acting as resistance at circa 95.
Update: Price is trading above the weekly moving average but has remained in consolidation.
Conclusion: Waiting for a breakout above the March 2019 high.
Sublime Trading


Il dollar index pare non averne piùQuesto canale è composto da una parte superiore e una inferiore, formatasi dal 2019 in poi, divise dalla linea tratteggia..
Il prezzo si trova ora sullo spike di agosto 2018, che coincide anche con la linea tratteggiata, e pare aver già reagito
a questa struttura.. lo si vede meglio sul grafico daily, dove nella candela di oggi (7 marzo) il prezzo è stato respinto seppur in modo debole..
La mia opinione personale è che il prezzo riesca a tornare nella parte superiore del canale, anzi mi aspetto qualche settimana short.


USDX will dropThe dollar almost complete the buy model and now probabbly will reach 96.6, 96.8, or 97 then it will drop breaking all lows and it will make a lowEr low around 94.5.

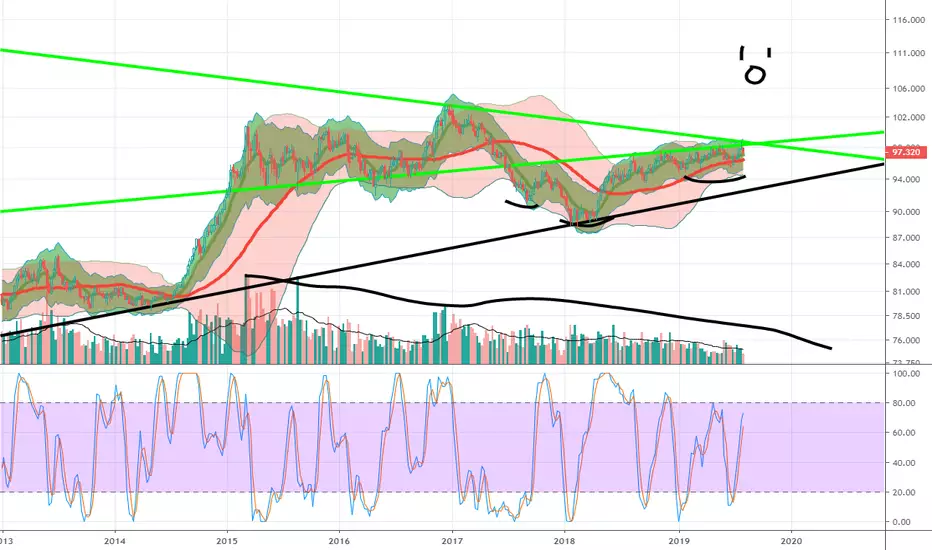
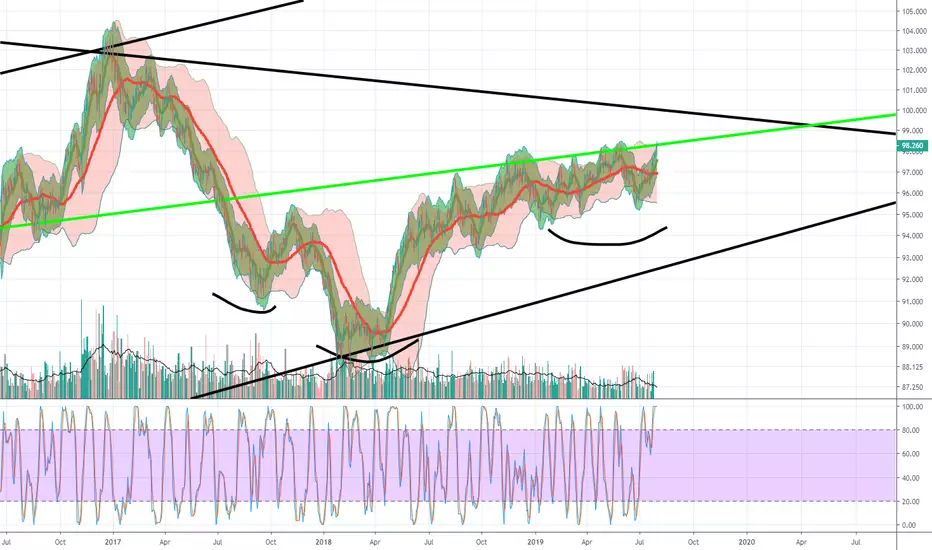
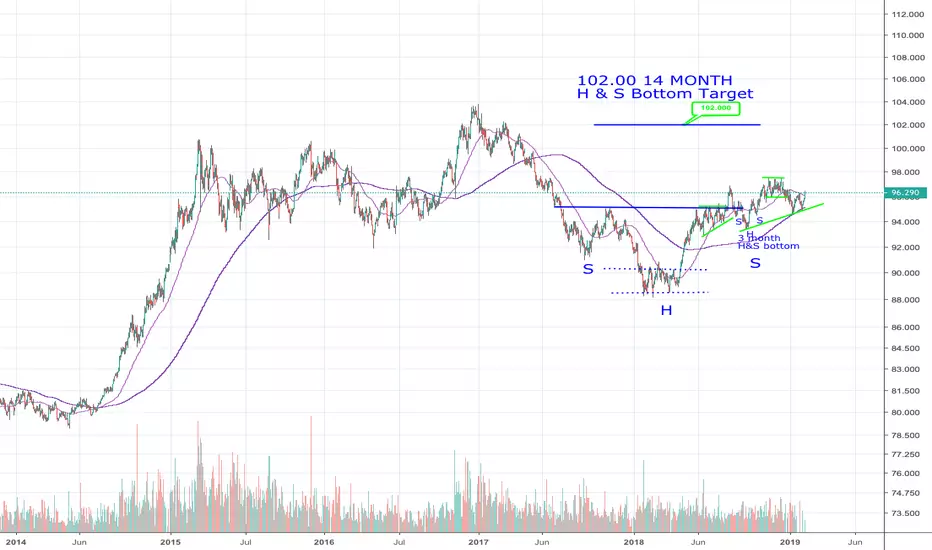
DXY GOING HIGHERUS DOLLAR GOING HIGHER - BOTH USD AND GOLD FORMED H & S REVERSAL PATTERNS - COULD BE CORRELATED - SHORT FIAT LONG-TERM BUT SHORT-TERM DOLLAR APPEARS STRONG

DOLAR INDEX POSSIBLE DOWNTREND1- BUY CLIMAX "BCLX":The buying pressure culminates, where purchases are being absorbed.
2- AUTOMATIC RALLY "AR":Where the buying pressure has been exhausted a surge of sales can make the price fall, this fall in price helps us define the trading range "TR".
3- SECONDARY TEST "ST":Price revisits the "BCLX" Area .The volume and the price distribution should be significantly reduced as the market approaches the resistance in the "BCLX" Area.
4- UPTHRUST "UT": It is a test to the resistance, this type of test it is usually accompanied by volume and tend to breaks the resistance, and after this,
the price returns to the trading range, this is an indication that the volume that appeared is sales and not buys.
5- After an upthrust we should see a move down and we will have a test to the "UT" (a valid test is usually accompanied by small candles and small volume and usually goes to 50% of the down movement).
6- SIGN OF WEAKNESS "SOW": Sign of weakness, observable as a down-move to (or slightly past) the lower boundary of the TR, usually occurring on increased spread and volume.
7. LAST POINT OF SUPPLY "LPSY": This point appears after a "SOW". It is the last attempt of the price to raise, although it can do it twice. It's a good point to look for sales.


Happy New Year (2019)To the old and celebrated friends and mentors I have gained over my 5 years on this platform, I hope the New Year brings you joy and grace God willing.

U.S Dollar Daily Chart.A break out from this level will bring further malnutrition state to the Asia Stock Market.
A failure to break out but reversed all the way down or even breaking down the EMA200days support will bring cheers to the Asia Stock Market.

DOLLAR INDEX ANALYSISIn recent weeks the Dollar Index has moved within a rectangle. If we take the analysis on a "fundamental" level, it could be an inversion rectangle.
Yesterday, the Fed raised rates. In the early hours, the dollar strengthened. It was enough, however, a reading of the Economic Projections to understand that the dollar came out weakened by the meeting. Briefly, almost all data were revised downwards (compared to the previous September report). In particular, the GDP dropped from 3.1% to 3.0% for this year and from 2.5% to 2.3% in 2019. The rate hikes, forecast three times in 2019, fell to two (at the moment). So, fewer rate hikes and weakened economic conditions certainly don't help the dollar.
However, we have to take into account that, right now, it's not the best time to trade. In five days it's Christmas, and most of the big investors are currently out of the markets. So, everything becomes more complicated. In the medium-term, I'm convinced that we will see a drop in the dollar but in the short-term, anything can happen.
To all of you Merry Christmas and a New Year full of gains!!

DXY ENTERING BEAR CYCLEPlease excuse the inverse 0-DX1! chart...when this goes up it means dxy is going down.
