DX1! - Weekly Market Update, 5/9/22US Dollar Index remains testing all-time highs.
At this time, I do not see any actionable setups that meet my criteria.
Wishing you a blessed and profitable week!
DX1! trade ideas

US DOLLAR - Seniorage104.55 presents some issues for the perennial DX Bears.
Will it arrive, we've been suggesting as much for months on end.
It is quite often Gold Bugs who cheer the Dollars demise, without
realizing Gold has moved up with the Dollar.
Why?
Curious is it not, but the answer is simply Fear.
Projecting what should never be... is not a winning trade in Fear.
We are reaching the later stage of Capitulation, extreme volatility
signals this event.
Tomorrow will be interesting as the MAY VIX Futures left several micro
Gaps below @ 29.24 and 30.05.
Is the end near?
Yes, it is quickly and violently approaching.
We will be watching the ES reaction @ 3949.50.
Trade safe and good luck~!
HK

Renko charts - Clean out the noiseI recently attended a talk by Stephen Hoad on behalf of the STA for the CISI, where he discussed his use of Renko charts. Well, it piqued my interest and I decided to take a closer look myself.
Renko charts were invented in Japan, they ignore time and just use price changes that meet a minimum requirement, which to my mind sounds exactly like Point & Figure charts (I love these). Instead of X-Columns and O-Columns, Renko charts use price “bricks” that represent a fixed price move. These bricks are sometimes referred to as “blocks” or “boxes.” They move up or down in 45-degree lines with one brick per vertical column. Bricks for upward price movements are one colour while bricks for falling price movements are filled in another colour. In the example attached I have a chart of the US Dollar Index, where upward price moves are green and downwards are red. This example uses a 0.5 brick size.
Please note the irregular time span along the y-axis . Also note that it uses an average true range of 14 days. For an explanation of average true range (ATR) please follow this link school.stockcharts.com
N.B when adding indicators say a 20-period moving average, this will be based on the last 20 Renko values NOT the last 20 days.
I always think that these types of charts look optically ‘cleaner’ or clearer than the more typical bar chart. They completely ignore time, and a brick is only drawn if price moves by a set amount. If it moves less than the set amount, no brick is drawn.
In contrast to fixed price bricks, using ATR values results in fluctuating brick sizes. The default ATR is based on 14 periods and the Average True Range fluctuates over time. The brick size is based on the ATR value at the time the chart is created. Should the ATR value change the next day, then this new ATR value will be used to set the brick size. Also note that ATR values are based on standard charts, such as close-only, bar and candlestick.
Disclaimer:
The information posted on Trading View is for informative purposes and is not intended to constitute advice in any form, including but not limited to investment, accounting, tax, legal or regulatory advice. The information therefore has no regard to the specific investment objectives, financial situation or particular needs of any specific recipient. Opinions expressed are our current opinions as of the date appearing on Trading View only. All illustrations, forecasts or hypothetical data are for illustrative purposes only. The Society of Technical Analysts Ltd does not make representation that the information provided is appropriate for use in all jurisdictions or by all Investors or other potential Investors. Parties are therefore responsible for compliance with applicable local laws and regulations. The Society of Technical Analysts will not be held liable for any loss or damage resulting directly or indirectly from the use of any information on this site.

Bites Of Trading Knowledge For New TOP Traders #11 (short read)Bites Of Trading Knowledge For New TOP Traders #11
----------------------------------------------------------------
What is Fundamental Analysis? -
Fundamental analysis is a method of determining a market’s “real value” or "fair market" value through the collection and examination of financial and economic information. Information gathered may include financial metrics which identify business drivers of the market, and could involve financial modeling of the market.
Fundamental analysts search for markets that are currently trading at prices that are higher or lower than what is expected to be their fair market value. If the fair market value is calculated to be higher than the market price, the market is deemed to be undervalued and could be considered to be bought. Conversely, if the fair market value is calculated to be lower than the market price, the market is deemed to be overvalued and could be considered to be sold.
What is Technical Analysis? -
Technical analysis is a method employed to evaluate a market and identify trading opportunities with a focus on inputs that include price and/or volume. Various financially based calculations and statistical models are commonly employed to derive price trends and patterns based upon which trading decisions are made.
Technical analysts believe past trading activity and price changes of a market could be valuable indicators of a market’s future price movements.
RISKS AND OPPORTUNITIES FOR CORPORATES AND INDIVIDUAL INVESTORS -
Common application of financial market instruments for managing risk and opportunities.
Portfolio Diversification
Portfolio diversification is the process of investing your money in different asset classes and securities in order to minimize the overall risk of the portfolio.
For both corporate and individual investors, having access to markets that enable the building of a diversified portfolio is an important consideration when managing futures focused accounts.
Similar to managing risk, the market to trade would be a key variable to clearly state and support with reasons for trading or investing. Reasons for selecting one market over another could include price volatility, liquidity, daily volume traded, size of the minimum price increment, and value of the minimum price increment. Comparing these variables between markets will help decide the suitability and/or risk of each.
For example, the parameters for a price driven strategy may be designed to be applied to any market whether it be index equity futures or forex futures. However, the signals for entry may not always trigger if a trader were just to focus on a single index equity futures such as the Micro MSCI Europe Index futures. Having access to other futures markets, such as the Mini Onshore Renminbi/US Dollar Futures, can introduce both a foreign currency and Asian element to a portfolio. This allows for the creation of a diversified portfolio with varying entry and exit points, or the ability for more trading oriented investors, increased opportunities to execute price driven strategies more often across a range of futures markets.
TRADDICTIV · Research Team
--------
Disclaimer:
We do not provide investment advice, nor provide any personalized investment recommendations and/or advice in making a decision to trade. Before you start trading, please make sure you have considered your entire financial situation, including financial commitments and you understand that trading is highly speculative and that you could sustain significant losses.

The Euro Is Heading for Parity Against the DollarThe US dollar and the euro are the world’s reserve currencies. Political and economic stability and free convertibility are the requirements for reserve currency status. Central banks and governments worldwide gold the US and European currencies as reserve assets.
The exchange rate between the US dollar and the euro is multifactorial. Interest rate differentials, political trends, and other issues determine the value of each foreign exchange instrument versus the other. The euro has been around since January 1, 1999, and euro notes and coins were only available two decades ago, in 2002. The euro currency opened for trading in the futures market in April 2001 at an exchange rate of $0.8760 versus the US dollar.
The euro first rose above parity with the US currency in July 2002. The last time it was below was in December 2002, but the recent exchange rate price action and the factors determining currency values could send the euro back to levels not seen in two decades.
New highs in the dollar index- Approaching the test of the 2020 high
The US dollar index has a 57.6% exposure to the euro currency. Since January 2021, the dollar index has been on a bullish path, making higher lows and higher highs.
As the chart highlights, the dollar index futures contract moved from a low of 89.165 in early January 2021 to the most recent high of 103.950 on April 28, 2022, a 16.6% rise. The index is approaching a critical technical resistance level.
The long-term chart shows the upside target stands at the March 2020 103.960 high, the highest level for the index since 2022. A break above that level will make the next upside target the July 2001 121.290 high. A move towards that level would push the euro below parity against the US dollar for the first time in two decades.
Lower lows in the euro versus the US dollar foreign exchange relationship
A bearish trend in the euro versus the US dollar currency relationship is nothing new.
The chart shows the euro reached an all-time high against the dollar in July 2008 at $1.6038. Since then, it has been all downhill for the European currency. The euro reached a low of $1.03405 in January 2017. After a recovery took the euro to above the $1.25 level in February 2018, the downtrend resumed, and it was approaching the early 2017 low on April 29 at below the $1.075272 level. A move below the $1.03405 level makes the target the critical psychological parity level.
Herding cats- The European economic challenge
The European Union is a collection of countries with diverse cultures. Moreover, economic policy is a blend of different orientations to monetary and fiscal policies.
Southern Europe has depended on tourism and has had a far looser approach to economic management than the austerity of the north. The north has been the industrial powerhouse, providing financial stability for the Union.
Greece, Italy, Spain, and Portugal are far different economies than Germany, France, the Netherlands, and Belgium. Policy agreement between the Union members has been like herding feral cats over the past two decades. The north has bailed out the south routinely, causing stress on relationships within the Union and pressure on the euro currency.
Cultural differences have been the borders since the establishment of the European Union and continue to be a factor that impacts the euro’s value.
War on the border- An aggressive Russia is bad news for the euro
In early 2022, the European Union is facing its most challenging test since its birth. Russia’s invasion of Ukraine launched the first major war in Europe since WW II. Russian aggression is a challenge to NATO countries, particularly those bordering the former Soviet Empire. Over the coming years, European military budgets will need to dramatically increase to provide safety and deterrence against the Russian aggressor. As military spending rises, it is likely to pressure the euro currency as the Union faces new threats that transcend the costs of the cultural divide between the northern and southern countries. The threat will likely unify the north and south, but the price tag for unification will be staggering.
Rising US rates are another nail in the euro’s coffin- Parity is only the first stop – The trend is your friend
In currencies, exchange rates are highly sensitive to interest rate differentials. The US dollar and euro are the world’s reserve currencies. The US central bank has shifted its monetary policy path to a more hawkish approach with inflation. raging.
The March consumer and producer price indices rose by 8.5% and 11.2%, respectively. The US Fed ended its quantitative easing in March 2022 and will quickly shift to quantitative tightening, allowing debt securities to roll off its swollen balance sheet at maturities. The FOMC will increase the short-term Fed Funds rate by at least 50 basis points at this week’s May 4 meeting. US short-term interest rates are going nowhere but higher.
Meanwhile, the US 30-Year Treasury bond futures have been a falling knife, pushing interest rates higher further out along the yield curve.
The chart shows the decline in the long bond futures since the March 2020 high. The most recent 138-14 low on April 20, 2021, took the bellwether government bond futures to the lowest level since November 2018. Critical technical support stands at the October 2018 136-16 low. Below there, the next target is the 2013 127-23 low.
A falling bond market and higher interest rates make the dollar more attractive than the euro. Europe cannot afford to increase interest rates and keep pace with the US dollar interest hikes because of its economic and geopolitical landscapes. Therefore, the dollar’s bullish trend will likely continue over the coming weeks and months.
Bull and bear markets rarely move in straight lines. Currency markets tend to experience far lower volatility than stocks, bonds, commodities, and other asset classes as governments manage price moves with intervention to provide stability. However, technical and fundamental factors support the path to parity for the dollar and euro currencies. In 2000, the euro reached $0.8901 against the dollar, the long-term technical target.
A stronger dollar and weak euro will have significant ramifications for markets across all asset classes, but the currency markets are a mirage as they trade in a vacuum. A trip to the supermarket, gas pump, or purchasing any goods or services in dollars reveals that the US currency has lost substantial purchasing power over the past year. The dollar may be strong against the euro, and it looks set to continue the current path, but all fiat currencies are losing power. As one strategist said the dollar is “the cleanest shirt in the dirty laundry.”
--
Trading advice given in this communication, if any, is based on information taken from trades and statistical services and other sources that we believe are reliable. The author does not guarantee that such information is accurate or complete and it should not be relied upon as such. Trading advice reflects the author’s good faith judgment at a specific time and is subject to change without notice. There is no guarantee that the advice the author provides will result in profitable trades. There is risk of loss in all futures and options trading. Any investment involves substantial risks, including, but not limited to, pricing volatility , inadequate liquidity, and the potential complete loss of principal. This article does not in any way constitute an offer or solicitation of an offer to buy or sell any investment, security, or commodity discussed herein, or any security in any jurisdiction in which such an offer would be unlawful under the securities laws of such jurisdiction.

US Dollar Could Go Higher!Since June 2021, price has been moving up strong, ploughing through the $100 major
round number, which is a psychological level of support/resistance.
April’s monthly candle closed bullish for the month and saw a move of 4.64% but was
stopped in its tracks by a major level of resistance.
The consolidation high at $103 is acting as resistance and this level was formed in
January 2017. Price has been moving sideways ever since, between this high and the
support at $88 from February 2018.
This is a wide area of consolidation so price has been able to form trends in this zone,
but a breakout could lead to an even bigger trend forming over a longer period of time.
Similar to the S&P 500, price is very close to breaking out. In this case, a pattern of
higher highs and higher lows above the consolidation zone, would be our signal to look
for entry opportunities.
Patience for now as the buyers and sellers battle it out where the outcome will determine
if we can go long or continue to stand aside.
If you like enjoyed this post, make sure to like, and follow for more quality content!
If you have any questions or comments, comment below. We reply to every comment!
See below for more information on our trading techniques.
As always, keep it simple, keep it Sublime.

Bites Of Trading Knowledge For New TOP Traders #10 (short read)Bites Of Trading Knowledge For New TOP Traders #10
----------------------------------------------------------------
What is the Notional Value of a Futures Contract? -
Notional value of a futures contract is how much total value the contract theoretically controls.
Contract Size * Underlying Price = Notional Value Mini US Dollar Index® Futures (SDX) for example has a contract size of $200 x Index value and assuming the SDX price is 98.000, the notional value of the futures contract is $19,600.00.
What is the difference between Margin and Leverage? -
Margin is the amount of money deposited with the broker to control a futures contract. It is determined by the futures exchange and maybe adjusted by the broker to manage risk to their clients.
Leverage is the ability to use less money to theoretically control 1 futures contract compared with buying the product underlying the contract outright which amounts to the notional value of the futures contract.
To calculate how much leverage a futures contract gives, divide the notional value of the contract by the margin. The SDX example above had a notional value of $19,600.00 and with a margin requirement of $380, is equal to approximately 51 times leverage on our money ($19,600.00 / $380 = 51).
What is a Point and a Tick? -
Point is the smallest price increment that can occur on the left side of the decimal point. (Example. 90.000)
Tick is the price movement that occurs on the right side of the decimal when looking at the price of a futures contract and is the smallest possible price change measured by markets. A Point is composed of Ticks. (Example. 90.000) Mini US Dollar Index® Futures (SDX) has a minimum price fluctuation of $0.005 representing one tick and would move from 90.000 to 90.005. It takes 200 ticks to make one point or a move from 90.000 to 91.000.
RISKS AND OPPORTUNITIES FOR CORPORATES AND INDIVIDUAL INVESTORS -
Common application of financial market instruments for managing risk and opportunities.
Hedging Portfolio Risk
Hedging spot Australian Dollar (AUD) exposure with the Mini US Dollar Index® Futures (SDX) contract is a way to manage portfolio risk by taking a directional position opposite to the underlying asset as protection. For example, a hedger may have plans to hedge downward price movement in AUD using futures contracts based on in-house market and portfolio analytical processes. The market analysis may use common technical analytical techniques such as support and resistance to formulate the trade decision. In the chart (Figure 1), if AUD is expected to weaken as it nears the resistance areas, the hedger may plan to enter into a long futures position using the Mini US Dollar Index® Futures (SDX) contract at or under the price levels of $0.7560 or $0.7460 to lock in the value of their underlying AUD position.
TRADDICTIV · Research Team
--------
Disclaimer:
We do not provide investment advice, nor provide any personalized investment recommendations and/or advice in making a decision to trade. Before you start trading, please make sure you have considered your entire financial situation, including financial commitments and you understand that trading is highly speculative and that you could sustain significant losses.

Bites Of Trading Knowledge For New TOP Traders #9 (short read)Bites Of Trading Knowledge For New TOP Traders #9
---------------------------------------------------------------
What is Hedging? -
Hedging is the action taken through the use of a financial instrument to minimize the loss or risk of the loss of value of an asset due to adverse asset price movements.
Who are Hedgers? -
Hedgers are market participants such as commodity producers who want to lock in selling prices of commodities they produce, or food manufacturers who want to lock in buying prices of raw materials purchased.
Market participants also include financial institutions handling financial assets and use derivative products such as futures to manage the risk of a portfolio of financial assets.
What is the difference between Physically Delivered vs Cash Settled Futures Contracts? -
Physical delivery is a term in a futures contract which requires the actual underlying asset to be “physically delivered” upon the specified delivery date, rather than being traded out with an offsetting contract.
Cash settled futures on the other hand allows for the net cash amount to be paid or received on the settlement date of the futures contract.
Futures exchanges may offer both types of contracts to market participants who have different purposes for trading futures contracts.
RISKS AND OPPORTUNITIES FOR CORPORATES AND INDIVIDUAL INVESTORS -
Common application of financial market instruments for managing risk and opportunities.
Risk management is the responsibility of market participants designed to limit risk exposures that specifically applies to the participants financial profile in the market.
The financial profile of a participant may include their role in the financial market or the amount of capital under their responsibility to be managed in the market, and therefore the risk variables that each would need to identify may be unique.
For both corporate and individual investors, the market to trade would be a key variable to clearly state and support with reasons for trading or investing. Reasons for selecting one market over another could include price volatility, liquidity, daily volume traded, size of the minimum price increment, and value of the minimum price increment. Comparing these variables between markets will help decide the suitability and/or risk of each.
For example, if Mini-Brent Crude Oil futures (BM) moves around $2.00 per day (or 2 points) and a point is worth $100, a trader might experience a $200 fluctuation in their account balance for one day. Another example is the U.S Dollar / Singapore Dollar (USDSGD), which could move 70 pips or more per day and trading a standard lot size with each pip worth $10, a $700 fluctuation could be expected for one day.
Market participants may also manage their risk through the size of their positions. The larger their position size, the greater is their exposure and the smaller their position size their exposure is lower. Investors should determine the risk that would result from various position sizes and select the size that ensures that their risk limit is not exceeded.
Finally, setting stops with a specified loss amount provides protection if the market does not move in the desired direction. It helps to prevent creating a loss scenario which is larger than an account can handle.
TRADDICTIV · Research Team
--------
Disclaimer:
We do not provide investment advice, nor provide any personalized investment recommendations and/or advice in making a decision to trade. Before you start trading, please make sure you have considered your entire financial situation, including financial commitments and you understand that trading is highly speculative and that you could sustain significant losses.

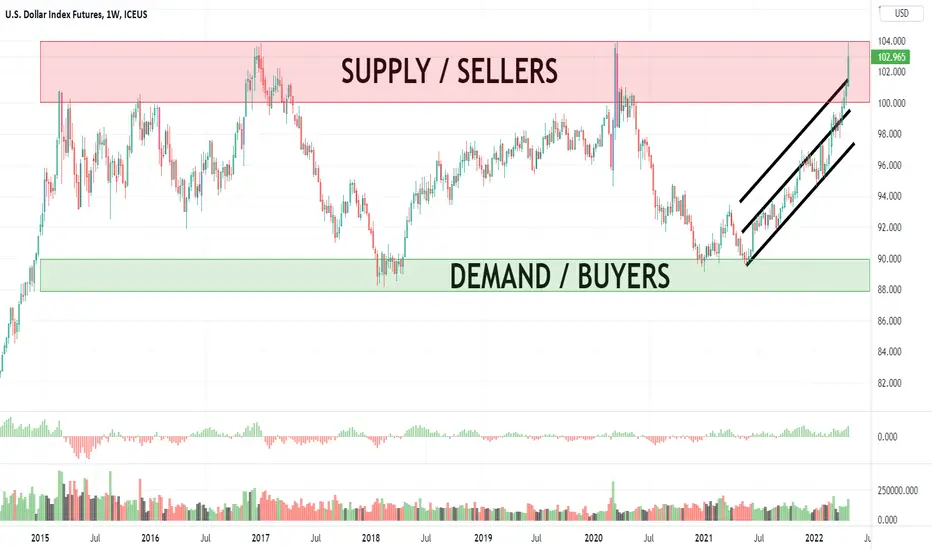
DX1! - Weekly Market Update, 5/2/22The US Dollar Index rallies into historical supply / resistance. The Dollar has typically fallen off hard after testing this area historically. We'll be watching it closely.
DXY USDollar Weekly ContinuousThe high to low cycle in the dollar is looking to complete the primary target at the 88% retracement price at 102.25.
**High to low cycle: Pivot high to Low retracement and have price action surpass the 24% retracement and downtrend line. Move up to fill the 38% target and hold uptrend without making a new low.
Further upside targets
Resistance above at 103.96
Support at 96.94 and 94.58

DXY Trading The Bullish SequenceIn this update we review the recent price action in the Dollar Index and identify the next high probability trade location and price objectives to target

Elliott Wave View: Dollar Index (DXY) Should Continue to Extend Short term view in Dollar Index (DXY) suggests the cycle from March 30, 2022 low is ongoing as an impulse Elliott Wave structure. Up from March 30 low, wave (i) ended at 100.52 and pullback in wave (ii) ended at 99.57. Index then resumes higher in wave (iii) towards 100.76. Dips in wave (iv) ended at 100.27, and final leg wave (v) ended at 101.03. This completed wave ((i)) in higher degree.
Index then pullback in wave ((ii)) which ended at 99.81. Dollar then rallies higher again and wave ((iii)) is proposed complete at 103.28. If the Index breaks above 103.28 again, then this suggests wave ((iii)) still remains in progress. Short term pullback in wave ((iv)) can see the Index correcting the rally from April 21 low before it resumes higher again.
Pullback is proposed to be in the form of a zigzag (a)-(b)-(c). Near term, as far as March 30 pivot low at 97.7 holds, expect any pullback to find support in 3, 7, or 11 swing for further upside. Assuming wave ((iii)) has really ended, ideally wave ((iv)) ends around 23.6 – 38.2 Fibonacci retracement of wave ((iii)). This comes at 101.95 – 102.46.

Market krach?the dollar is coming towards a resistance of march 2020 it's not a good sign for the markets which will fall like at the time of the Covid I hope a reversal of situation otherwise we will see a btc 35k even worse same for the sp500 AND the NASDAQ which will test its old support of march

the abducted us dollathe us dollar seems to be getting abducted by aliens here.
it will likely continue getting pulled until 112~113 algo target is met.
this will complete the longer term wave count, and it could begin a decade long correction to the downside after
(in theory).

US Dollar Above $100!The US Dollar continues to gain strength and has been in a consistent rise
since June 2021, where we have seen price climb 13.06%.
Note that price is still inside a long-term area of consolidation that has lasted
since January 2017, between a high of 103.96 and a low of 88.15.
As this is a wide area of consolidation, price has enough room to form a trend
that is currently in play and moving strong, especially for this month.
Price is now trading above the $100 round number and moving towards the
consolidation resistance level at 88.15.
If we have a breakout of the resistance level, we should see a big trend unfold
because the larger the area of consolidation, the bigger the move in the direction
of the breakout.
Patience for now. If price breaks out, we will likely see other forex pairs form strong trends.
If you like enjoyed this post, make sure to like, and follow for more quality content!
If you have any questions or comments, comment below. We reply to every comment!
See below for more information on our trading techniques.
As always, keep it simple, keep it Sublime.

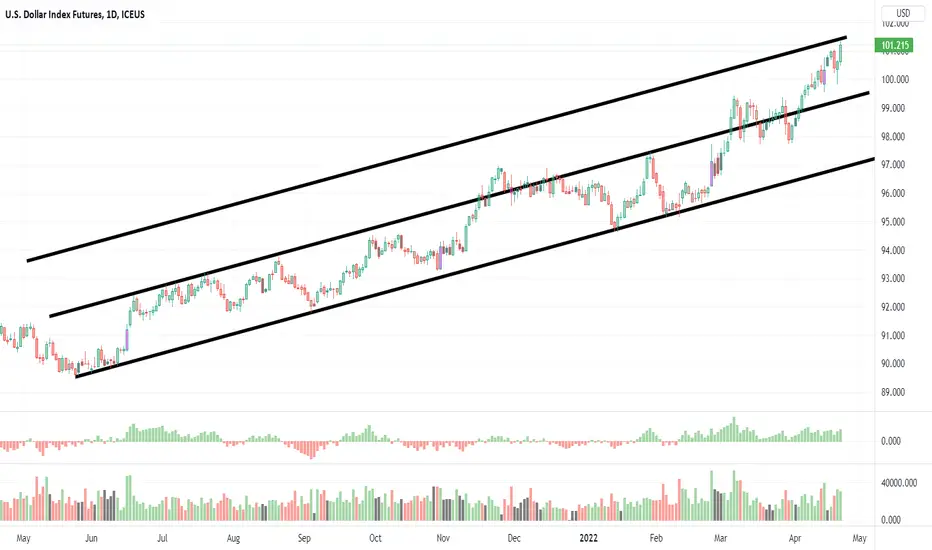
DX1! - Weekly Market Update, 4/25/22The dollar index continues to prove strong as it approaches notable resistance. A rather simple channel and extension structure tells the entire story. Enjoy!
DXY Trading The Bullish SequenceIN this update we review the recent price action in the Dollar Index and identify the next high probability trading opportunities and price objectives to target.


DXY - The shortMomentum looks to be running out on this trend and a bull flag pattern has been formed.

DX1! - Weekly Market Update, 4/18/22US Dollar Index has confirmed an upside breakout, however, when inputting the buffer for the target
we are offered ZERO profit opportunity. I've indicated key areas of support and resistance on the chart
for this upcoming week for our shorter-term traders to use.
DX Index Futures
Hello ladies and gentlemen, according to my graphical analysis of DX dollar indix futures ,I recommend for the moment sell DX, to because there is a great probability of to reach 99,305$

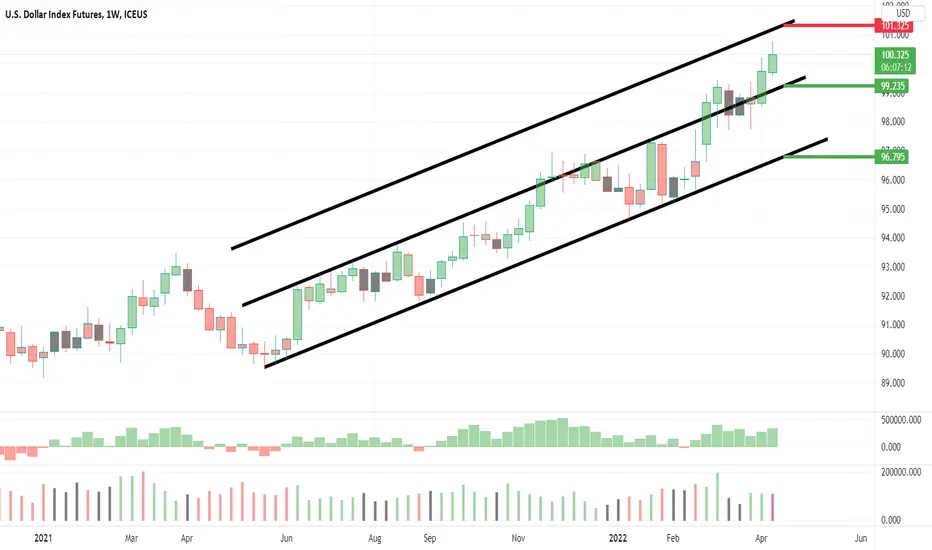
DX1! - Weekly Market Update, 4/11Indicated areas of support (green) and areas of resistance (red) are ascending (rising) and descending (falling).
These areas indicated suggest support / resistance for the week of April 11 and either rise or fall based on their channel structure ascending or descending.
Please check back for any mid-week updates. Wishing you a profitable week ahead! Anthony Speciale

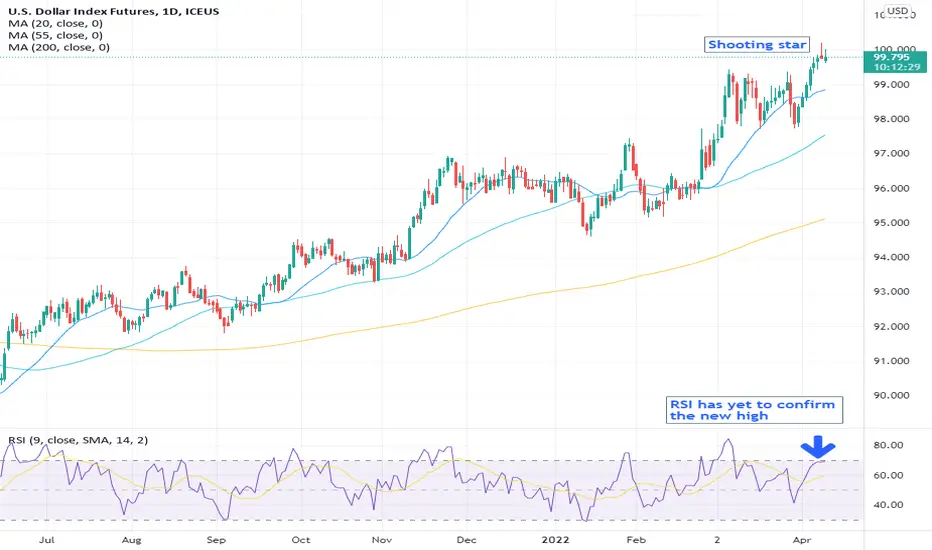
Don’t shoot the messenger!While there has been much commentary about the US Dollar Index hitting 100.00, we note two things from a technical perspective – the first is a shooting star pattern on the candlestick charts and the second is that the daily RSI has yet to confirm the recent high.
This happens when price makes a new high, but the oscillator does not – it is otherwise known as bearish divergence.
It generally denotes a loss of upside momentum.
The shooting star however is a bit more serious this is a bearish reversal candlestick pattern that typically occurs at the top of uptrends.
I would suggest tightening the stops in this one as I suspect that we are going to see some profit taking….
A shooting star is created when the open, low, and close are roughly the same price. Also, there is a long upper shadow, generally defined as at least twice the length of the real body.
Disclaimer:
The information posted on Trading View is for informative purposes and is not intended to constitute advice in any form, including but not limited to investment, accounting, tax, legal or regulatory advice. The information therefore has no regard to the specific investment objectives, financial situation or particular needs of any specific recipient. Opinions expressed are our current opinions as of the date appearing on Trading View only. All illustrations, forecasts or hypothetical data are for illustrative purposes only. The Society of Technical Analysts Ltd does not make representation that the information provided is appropriate for use in all jurisdictions or by all Investors or other potential Investors. Parties are therefore responsible for compliance with applicable local laws and regulations. The Society of Technical Analysts will not be held liable for any loss or damage resulting directly or indirectly from the use of any information on this site.