Elliott Wave View: Dollar Index (DXY) Resumes HigherShort Term outlook in Dollar Index (DXY) suggests the decline from March 7, 2022 peak ended in wave (4) at 97.68. Internal subdivision of wave (4) unfolded as a zigzag Elliott Wave structure. Down from March 7 peak, wave A ended at 97.71 and rally in wave B ended at 99.37. The Index then resumed lower in wave C towards 97.68 which completed wave (4) in higher degree. The Dollar has turned higher in wave (5). Internal subdivision of wave (5) is in progress as a 5 waves impulse.
Up from wave (4), wave (i) ended at 98.36 and pulllback in wave (ii) ended at 97.9. Index then resumes higher in wave (iii) to 99.08. Expect Index to pullback in wave (iv) and then extend higher again one more leg in wave (v) before it completes wave ((i)). Afterwards, expect a wave ((ii)) pullback to correct the rally from wave (4) low on March 30 before the Index resumes higher again. Near term, as far as March 30 low pivot at 97.68 stays intact, expect dips to find support in the sequence of 3, 7, or 11 swing for further upside.
DX1! trade ideas

DXY Do or Die Trend Channel TestIn this update we review the recent price action in the Dollar Index and identify the next high probability trade locations and price objectives to target.

Dx go down!?Dx broke up trend on 16th March, then failed to break recent high on 28th March and made lower on same day .
Seems like it begin down trend !

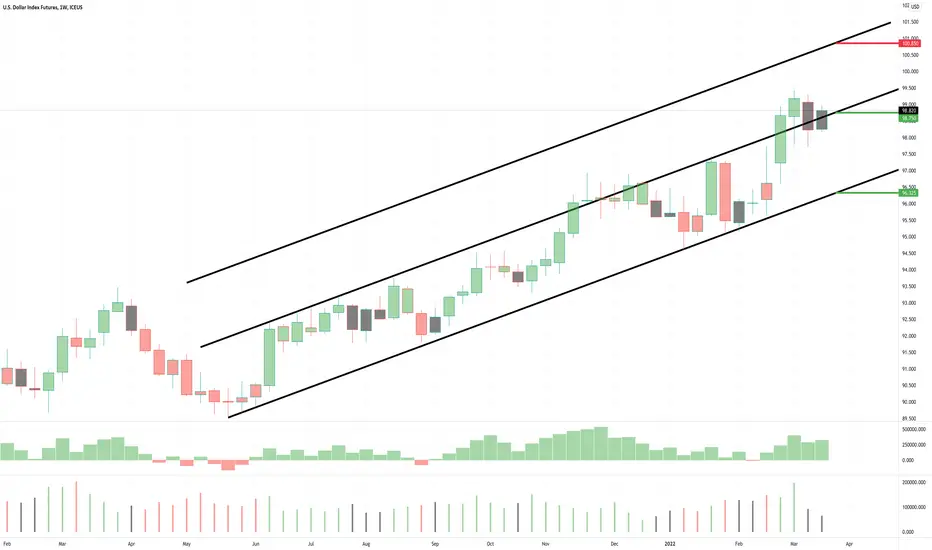
DX1! Weekly Market Update, 3/28Indicated areas of support (green) and areas of resistance (red) are ascending (rising) and descending (falling).
These areas indicated suggest support / resistance for the week of March 28 and either rise or fall based on their channel structure ascending or descending.
Please check back for any mid-week updates. You can also follow me on my social networks and my website, all links are located below.
Wishing you a profitable week ahead! Anthony Speciale
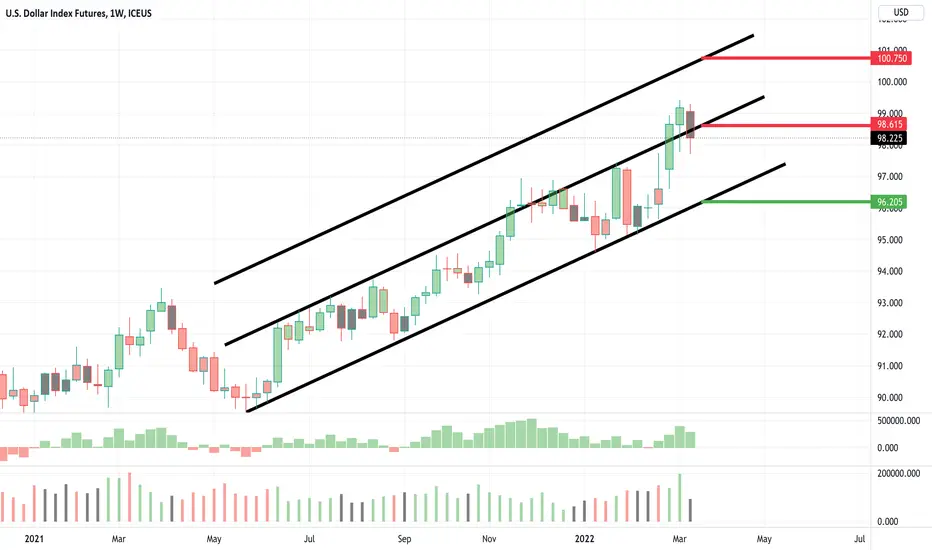
DX1! - Weekly Update, 3/21Indicated areas of support (green) and areas of resistance (red) are ascending (rising) and descending (falling).
These areas indicated suggest support / resistance for the week of March 21 and either rise or fall based on their channel structure ascending or descending.
Please check back for any mid-week updates. You can also follow me on my social networks and my website, all links are located below.
Wishing you a profitable week ahead! Anthony Speciale
Symmetrical Triangle Forming UpNearing a multi year symmetrical triangle monthly resistance level, if we see a bull push over the next week I suspect by the FOMC meeting, the scale of probability will significantly increase for bullish continuation. However, if the current hourly trend turns bearish, the likelyhood that symmetrical triangle resistance level has been verified increases and will continue to increase as more time frames follow; with significant downside. Allocate appropriately and respect the trends, disregard the fud, and good luck!!
-RSI neutral
-MACD bearish

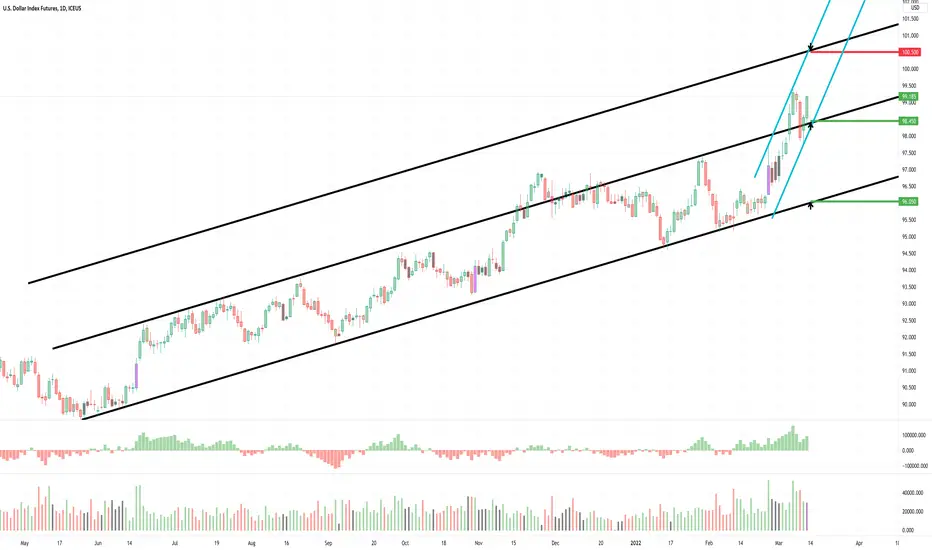
DX1! - Weekly Market Update, 3/14Indicated areas of support (green) and areas of resistance (red) are ascending (rising) and descending (falling).
These areas indicated suggested support / resistance for Monday, 3/13/22 and either rise or fall based on their channel structure ascending or descending.
Please check back for any mid-week updates. You can also follow me on my social networks and my website, all links are located below.
Wishing you a profitable week ahead! Anthony Speciale
DXY To Test Pivotal 78.6% FiboIn this update we review the recent price action in the Dollar Index and identify the next high probability trading pattern and price objectives to target.

DX1! COMING INTO YEARLY RESISTANCE ZONESO it has been awhile since I have posted on here. But I figured this could be of some value since it has been a long time since the dollar index has come into this "danger zone" so to call. The nice thing with trading is it's only dangerous if we don't know how to approach the markets. As traders we are the ones that determine our results.
Keep an eye on the dollar index as it comes into multi-year resistance. With the future plans the FED has with continuing to raise interest rates along with a strong previous week of buyer price action, I don't necessarily believe this is coming down this week but keep an eye on for the future to what the dollar does as usually the banks, government, etc. use these levels to determine economic decisions they make.
2 options here. 1st option is that the dollar continues this recent strength up into the top of this zone around the 103 price handle. Then we would have to see what price does from there. 2nd option is that price can react once again in this zone and start a bearish run for the US dollar.
Keep an eye out and lets see how the FED rules the dollar and how the technicals play out!
Cheers!
@JosePips

DXY (Dollar Index) : Anticipating DXY range for next few weeksDXY / USDOLLAR / DX1! is at equilibrium of its long term range (since Q1-2020). Hence I anticipate it'll be stuck in this range for quite a while - unless tensions escalate in Ukraine/Russia

DXY Risk Free Longs In PlayIN this update we review the recent price action in the Dollar Index and update the trade plan and price objectives to target

USD INDEX. do a little correction buddy!will it happen to DXY?
dxy needs a little correction to empower its trend.
may the fibo helps us !

Bites Of Trading Knowledge For New TOP Traders #8 (short read)Bites Of Trading Knowledge For New TOP Traders #8
---------------------------------------------------------------
What is a Digital Asset Wallet? –
A Digital Asset Wallet is a technology-based tool used to interact with a blockchain network. There are two types of wallets commonly grouped as software and hardware wallets. Alternatively, depending on their working mechanisms, they may also be referred to as “hot” or “cold” wallets.
Digital asset wallets generate the necessary information to send and receive digital tokens (“tokens”) via blockchain transactions. Significant information contained in the wallet includes an “address”, an alphanumeric identifier that is generated based on the public and private keys. It is a specific location on the blockchain to which tokens can be sent to and it may be publicly shared with others.
The private key should not be shared as it gives access to tokens held by the user, regardless of the type of wallet used.
Digital assets essentially never leave the blockchain as they are just transferred from one address to another within the blockchain network.
What is the difference between a “Hot” and “Cold” Wallet? –
Digital asset wallets may be defined as “hot”, “warm” or “cold,” according to their working mechanisms or the way they operate.
A hot wallet is any wallet that is continuously connected to the Internet. These wallets are easy to set up and enable funds to be readily accessible, making them convenient for users to transact. Centralized finance exchanges (CeFi) tend to provide their users with wallet technology to access their accounts, whereas decentralized finance exchanges and applications (DeFi) would require users to obtain a third-party wallet technology provider that allows them to connect to DeFi services.
Cold wallets are not connected to the Internet and use a physical medium to store information offline, such as private keys, making them resistant to online hacking attempts. While less convenient, cold wallets serve as a safer storage option.
RISKS AND OPPORTUNITIES FOR CORPORATES AND INDIVIDUAL INVESTORS –
Portfolio Focused on Global Macro Strategies –
Global macro strategies are used by funds to base their holdings on their overall economic and geopolitical analysis of various countries. Holdings may include long and short positions in various equity, fixed income, currency, commodities, and futures markets.
These funds take longer-term directional views of markets and may not always hedge their positions, but could actively manage their fund to take advantage of what they see as short-term moves opposite to their main view.
An individual investor with a long-term view of Brent crude oil who maintains long dated futures positions could consider using front or near month Mini Brent Crude Futures to actively take advantage of shorter-term retracements to certain price levels.
TRADDICTIV · Research Team
--------
Disclaimer:
We do not provide investment advice, nor provide any personalized investment recommendations and/or advice in making a decision to trade. Before you start trading, please make sure you have considered your entire financial situation, including financial commitments and you understand that trading is highly speculative and that you could sustain significant losses.

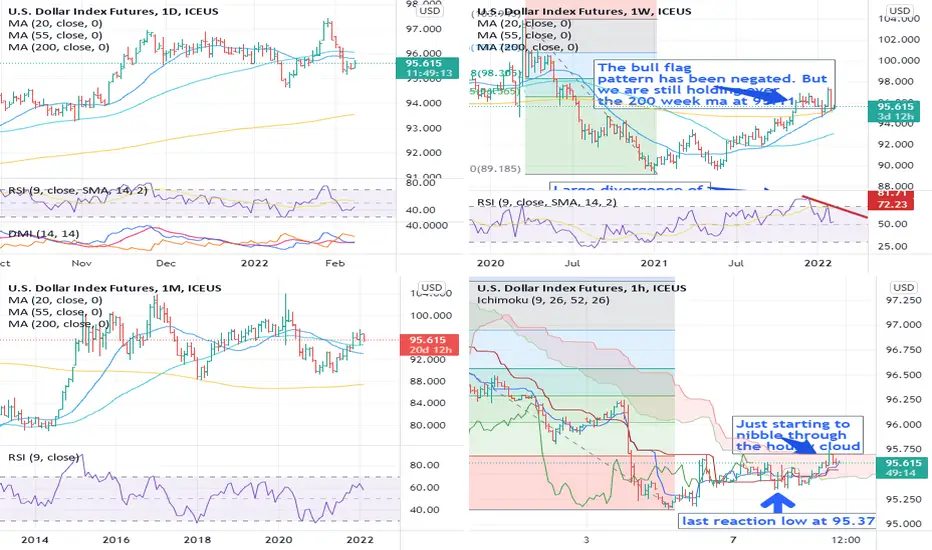
A crucial week for the US Dollar....The US CPI is out on Thursday, which is key, but the reason that we think this week is important for the Dollar is a technical one. We had previously been viewing this as a potential bull flag, however last weeks price action has negated that view, why? When a market breaks higher from a bull flag pattern it tends to be quite dynamic and directional, the break higher should be maintained and that is not what we are seeing here. This, for us, negates the bull flag pattern.
So, where does that leave us? Well, it’s not a bull flag BUT it has not done enough to negate the bull trend either… (definition of a bull trend is higher reaction highs and higher lows) and we can see quite clearly that the reaction back is finding some support at the 20-week and 200-week ma at 95.11.
For the bear camp argument, we also have a LARGE divergence of the weekly RSI, which reflects a significant loss of upside momentum.
So how to proceed? I’d leave well alone until a clearer chart picture emerges…. However, if you must trade it, we would suggest a light and nimble touch here is needed. Drop down into the hourly chart and we can see the market is starting to nibble through the top of an hourly cloud, which implies some very near-term strength, but stops should be kept close and the most recent low on the hourly chart was a 95.34, so I would be utilising stops below there…
Slightly longer term, the KEY support is going to be the 94.61, the January reaction low, as failure there would imply that the bears are winning and introduce scope to the 55-week ma at 93.04 currently. As we say, we suspect this week will be crucial for the Dollar and let’s hope that the US CPI triggers further directional impetus.
Disclaimer:
The information posted on Trading View is for informative purposes and is not intended to constitute advice in any form, including but not limited to investment, accounting, tax, legal or regulatory advice. The information therefore has no regard to the specific investment objectives, financial situation or particular needs of any specific recipient. Opinions expressed are our current opinions as of the date appearing on Trading View only. All illustrations, forecasts or hypothetical data are for illustrative purposes only. The Society of Technical Analysts Ltd does not make representation that the information provided is appropriate for use in all jurisdictions or by all Investors or other potential Investors. Parties are therefore responsible for compliance with applicable local laws and regulations. The Society of Technical Analysts will not be held liable for any loss or damage resulting directly or indirectly from the use of any information on this site.
DX1 rebound and reduced inflationFollowing March 2020, DX1 has decreased upwards of 13% with increased M2 money supply and inflation. As the next year unfolds the interest rate hikes will increase the dollars strength and hinder inflation.
Wave 1 begin Jan 2008 at 72 and peaked January 2009 at 84.5. There was a retrace into June 2011 at 74.
Wave 3 peaked at 101.74 in December 2016 and has been in a descending wedge formation since.
MACD flipped positive in August 2021. RSI is above 60 with bearish divergences for histogram, OBV and MFI.
Due to the macroeconomic backdrop and the Federal Reserves actions, I expect the wedge to bounce off the bottom and break to the upside
First take profit at $102 and second at the old high of $121.

REJECTION SETUP + BAT SETUP first we have BAT pattern has been completed with perfect levels
also we expect the price broke the channel just we have very important BOX from 95.275 to 96.200
we need to confirm the price action at these levels


An expected move for the descent of DX1DX1 analysis on the weekly chart
What I'm saying may be wrong, it's just personal effort, the responsibility lies with you

DX - JPY Provides DXY ImpulseTightening Liquidity... Stronger Dollar.
Bond Yields Higher... Stronger Dollar.
Uncle Buck, the Lonesome Cowboy with just a hand held
radio to keep him sane.
________________________________________________
This creates Gale force winds for the Indicies to Sail into.
Typically it is the Northerlies that create the Marching Elephants
in the Straights of Florida.
12 to 20 Foot waves that build as the Gulf Stream is countered
by Surface opposition.
__________________________________________________
A similar Natural phenomenon may be at work against the Indies.
We will see as this week is set up for the Break Higher or Lower.
Asia sees their own backyard, US Traders rarely bother, other than FX
Traders, to observe how and why the pairs behave.
A Carry trade is profitable if currencies are stable. They are NOT.
The Dollar rising against the Yen can be a large issue on interest rate
differentials - And Vice Versa.
An important week ahead for FX as the DXY spiked last week.
___________________________________________________

DXY To Fade On First Test Above 98In this update we review the recent price action in DXY and identify the next high probability trading opportunity and price objectives to target.

Powell Pushes Up the DollarThe Fed left its policy settings unchanged following its January policy meeting as expected. While responding to questions from the press, FOMC Chairman Jerome Powell noted that there was "quite a bit of room" to raise the policy rate without hurting the labour market. Powell further added that inflation has gotten worse since the December meeting and reaffirmed that the committee was in favour of hiking the policy rate in March "assuming that the conditions are appropriate for doing so."
On the 11th January 2022 I highlighted the potential bull flag on the US Dollar Index. This is what I wrote:
‘Being able to identify some basic technical analysis patterns can really help in your trading decision making. A bull flag suggests the break, as the name implies, should be to the topside. Patterns can help you decide whether to maintain a long position and just as importantly when to add to it. A close above the top of the flag will complete it and the ‘flagpole’ will give you an upside measurement or target for your trade.
On this example a close above 97.00 would complete the flag pattern and offer an upside measurement to 100.00 +.’
Having seen a strong rebound from the 20-week ma at 95.07 2-weeks ago, my opinion remains in play and this bull flag looks ready to break higher…trade accordingly.
Disclaimer:
The information posted on Trading View is for informative purposes and is not intended to constitute advice in any form, including but not limited to investment, accounting, tax, legal or regulatory advice. The information therefore has no regard to the specific investment objectives, financial situation or particular needs of any specific recipient. Opinions expressed are our current opinions as of the date appearing on Trading View only. All illustrations, forecasts or hypothetical data are for illustrative purposes only. The Society of Technical Analysts Ltd does not make representation that the information provided is appropriate for use in all jurisdictions or by all Investors or other potential Investors. Parties are therefore responsible for compliance with applicable local laws and regulations. The Society of Technical Analysts will not be held liable for any loss or damage resulting directly or indirectly from the use of any information on this site.

USD Index SHORTHello traders, according to my graphical analysis of DX1!, there is a high probability of a decline towards the support showing on the chart.
thank you for watching the analysis, it will be great when you support it with a like, follow me for more market analysis and good buy opportunities.

US Dollar Bear Market This graph demonstrates the last 5 years.
In March of 20 US starting spending heavily on Covid.
In January 21 Biden enters and retains the same fed chair and the US $ improves.
In November 21 The signs of inflation look like they are not transitory the US $ peaks and begin a bear market.
Today we languish 95.50 in a downturn that should take us to minimum 92 and if really bad 90.
There is big money to be made in trading the dollar on the downside.
