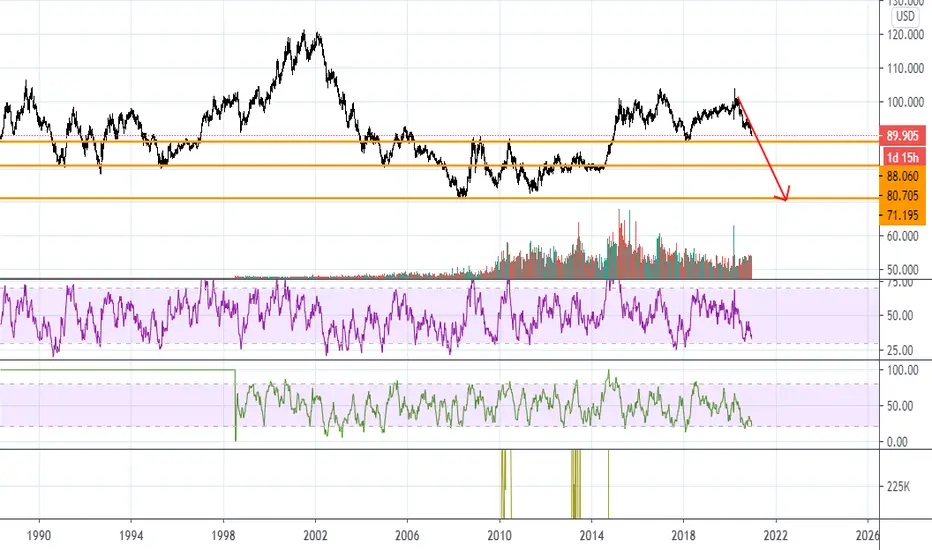
DXY (Dollar Index) Long term movement prediction for 2021DXY / DX1! / FX:USDOLLAR / Dollar Index is searching for liquidity, bouncing up and down in the process.
This is my long term prediction on how it could move - given no major economic shifts.
Option 1
DXY breaks below the Q1 2018 lows, collects liquidity
It then runs up to fill in the fair value gap from Q3 2020
It then falls down and get rejected from Q3 2014 lows as those trapped shorts exit - creating a rally
It then falls down again below Q3 2014 lows to collect liquidity
Heads back up again in search of liquidity
Option 2
DXY creates a short term low just before Q1 2018 liquidity run, so that it can trap even more traders
It then runs up to fill in the fair value gap from Q3 2020
It then falls down, collects the liquidity below Q1 2018 lows
Get rejected from Q3 2014 lows as those trapped shorts exit - creating a rally
It then falls down again below Q3 2014 lows to collect liquidity
Heads back up again in search of liquidity
DX1! trade ideas

History repeating... from a higher lowUS Dollar Index Future's Daily Point and Figure Chart. Reduce noise, see more clearly.

Trend Analysis US Dollar & the Clintonomic1. Joe Biden will assume the office of US Presidency on 20 Jan 2021 and this will be the most closely watched event as his presidential speech will move the world around.
2. History will repeat itself and highly likely Biden's economic policies will mirror Clintonomic (20 Jan 2021 - 20 Jan 2001).
3. During this period, US currency was trading astronomically bullish against major currencies.
4. As oil price is negatively correlated to US currency so during this period it was a slowing moving object but the most major factor was due to lack of geopolitical risk as Clinton was not interested in missile warhead and he was famously said that "it is the economy, stxxxd..."
5. If history were to repeat itself again, Biden will press down the oil price , cold start US economy, push up US currency and US stock market .
6. US will be back to the open door policy and back to the central of the world stage one more time and may see the sudden end of US-China cold war (military and trade as Clintonomic will cut military budget and save the money for local economy and weather protection) and a strong US economy will need to buy more cost effective manufactured goods from China and China will in turn be buying more US bond and that will help to propel US dollar to higher level.
www.investopedia.com

Time for the USD to rise again... The USD has been falling significantly, and is now bullishly divergent in technical terms with relation to the MACD and the Relative Price Momentum.
an early attempt was just made, and despite a hasty retreat, this may be forming the consolidative base before a breakout rally ensues.
This appears in line to expectations that the S&P500 is due for a pullback on bearish divergence, Gold having a suspicious type of short term rally, and Bitcoin pulling back slightly.

DXY (US Dollar) : Trapped tradersDXY (US Dollar) is trapping traders on both sides of the price : giving us both long and short trades when these traders exit.
Hoping for a Short trade first, then a long trade!

DX - DOllar headed t All Time LowWe've never had zero interest rates before.... there's no reason to hold the dollar.
This makes it virtually impossible to short foreign ETFs, and expect all imported products to become more expensive next year. If you've got big purchases to make, now's the time.

If Biden wins, that will mark a bottom in the dollar.Look at history. Since President Reagan, Republicans have been mercantilist and punish the dollar to benefit the big asset owners and exporters (of both goods and jobs). The dollar has firmed under Democrats who try to preserve the purchasing power of the broader public. If Joe Biden becomes President, expect a bottom in the dollar relatively quickly and for it to be range bound with an upward bias during his Presidency. Due to fiscal programs and better trade relations with allies, we'd see higher growth rates and a slight widening of the middle class again.
Should President Trump win, expect the dollar to get pummeled, for inflation to rise and for growth to stay flat. Under a second Trump term, I'd expect a period of stagflationary recession that could last for years. Frankly, I believe the next impeachment attempt would be successful as frustrated Republicans roll over on Trump.
Place your currency bets accordingly in coming months. The election matters.

DXY (Dollar Index) Monthly analysis : Market Structure Dec 2020DXY (Dollar index) is now forming trapped trader zones on Monthly and weekly timeframes on both sides of the price. This means we could see a range developing for next few weeks/months.

SHORT. BEARISH. DIPTake a deeper👁 look and go back.
Support Area
begans 89.999
TP.>>>>89.360
"Then SHAKE n BAKE "
#letstakeprofits
This is just my perception on money.

9% loss in the last 300 daysI dont think lots of explanation is needed, looks promising for next year's crash, 2021 gonna be a hell of a ride

The dollar selloff continue....Lost support, headed down to the next one as the chart shows.
I was looking at this because I want to short Japan & Korea, but it's best to wait until the dollar stops tanking. Looks to me like it will hit support next Friday, probably on the usual Friday pump.

USD Futures - Falling wedgeHedge down, buy the breakout. I expect MACD to curl upwards in the near future.
Targets listed based on volume, wedge height, and historical resistance/support.
I expect the USD to struggle in the next few years for multiple factors - QE, low Fed rate, unemployment, etc.
Profits can still be made. Cheers.

Yellen’s new appointment and future of American DollarDollar bears love hearing that Joe Biden (if and when he takes control of the White House) will appoint Janet Yellen as the next Treasury secretary, making Yellen the first woman to hold the position.
Traders see Yellen as a "dove", meaning she should be very accommodative and a strong proponent of rates staying lower for longer. Also, since she was formerly the Fed Chair and leader for the Council of Economic Advisors she will create a strong working relationship across the financial industry. Perhaps more than anything the market fully understands how Yellen communicates and views the economy. Remember, Yellen was Vice Chair under Fed Chair Ben Bernanke, during which they navigated the economy through the 2008 financial crisis.
As Fed Chair, she maintained the Fed's ultra-low rate policy well into 2015 and presided over a period of tremendous job growth.
Keep in mind, the head of the Treasury is typically the one negotiating with Congress on behalf of the White House, so it's seen as one of the most critical roles right now.
Let's also not forget we have some serious political uncertainty still in the mix during the next 45-days. with the run-off Senate election in Georgia, and the ongoing debates and recounts surrounding the Presidential debates.
This week we are waiting for Retail sales, the Empire State and Philadelphia Fed manufacturing surveys. Negative numbers plus virus cases rise, and lockdown fears may bring the dollar to new lows.
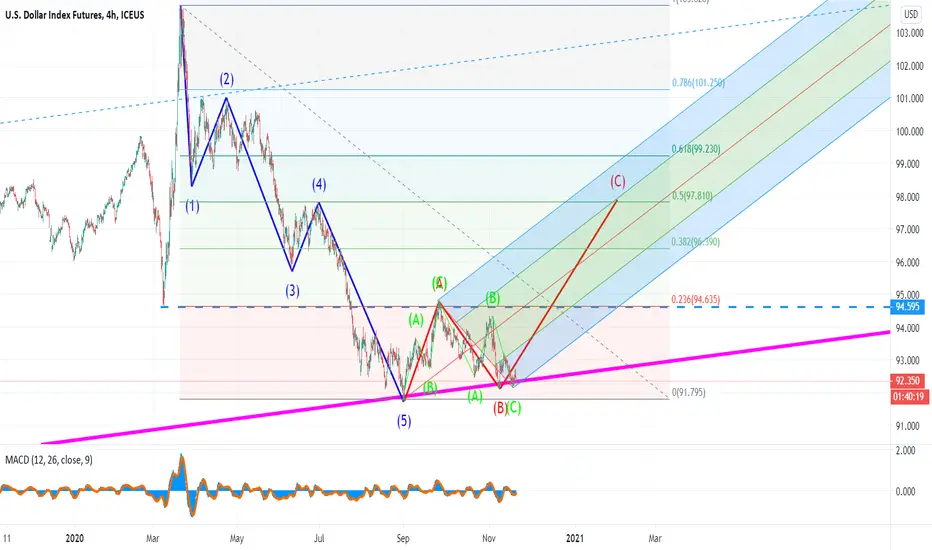
With all that in mind, I want to focus on the monthly chart of the American dollar. It has a flagging pattern similar to the one we saw in 2017. Taking into account all the fundamentals, there is a big chance to see another breakdown in a long-term perspective.
However, we are getting close to the end of the year, and the risk of potential massive profit booking is increasing. Closing of big positions may result in a rally to 96 range. I believe the 4h chart is the best option to focus on.


DXY : That feeling when you miss a successful entry by a hair!That feeling... - when everything you analyzed, played out exactly as expected - BUT you missed the entry by a hair!
:-(

DXY (Dollar Index) 4H : Trapped buyers waiting to exitDXY is currently bearish on all timeframes - D, W, M and it has now trapped a bunch of buyers in a false breakout on 4H - who would love an exit when price comes back to them!
For reference, DXY on Daily

DXY (Dollar Index) Monthly analysis - Market Structure : Nov 202The monthly analysis is a very useful barometer of understanding where Weekly and Daily charts could be headed next.
Once we know how DXY is going to move - corresponding correlations can also be anticipated for GBPUSD, EURUSD, USDCAD, USDCHF, etc.

With more money printed - DXY gets to new lowsWith more money printed - DXY gets to new lows
Bullish for equities & precious metals!

With more money printed - DXY fallsWith more money printed - DXY falls to new lows
Bullish for equities and precious metals!

DXY, Dixiewhat a beautiful buy setup and everyone talked about the demise of the dollar. never I said! BUY....

