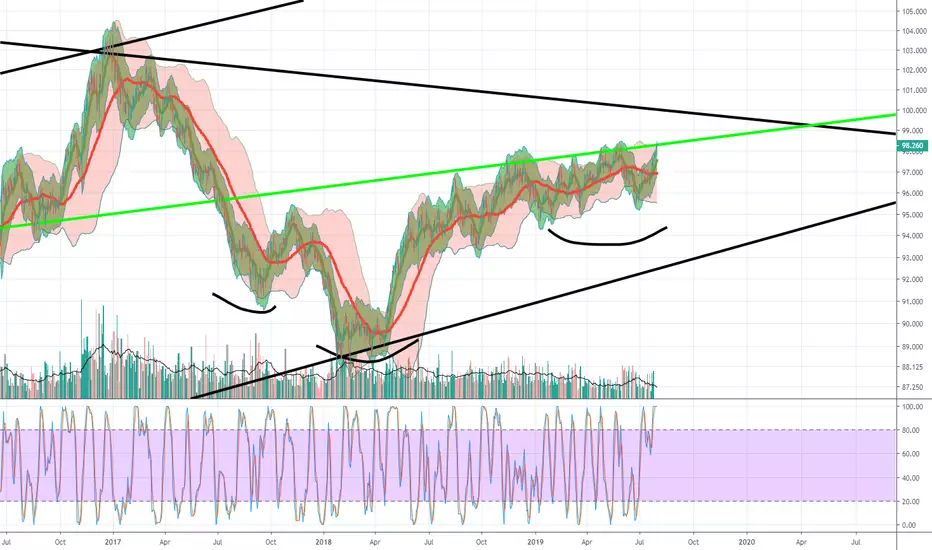
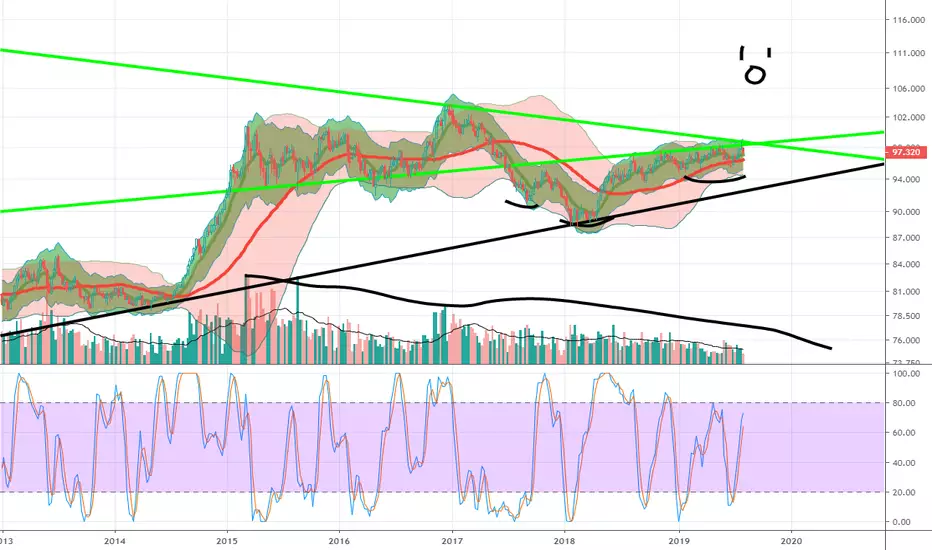
Bullish on the US Dollar FutureWe can see that there is a clear range illustrated by the market . The top and bottom blue lines are the new support and resistance.
We have two clear reasons to see that the possibilities for the market going bullish increasing significantly :
-The formation of the candlesticks on the support line, taping the line to rebound .
-Combined with the strong volume bigger than all of the other ones before.
Go bullish for the moment, we are in the middle of the range. Take decision after new analysis when the resistance is reached.
Possibilities:
-Pullback down again (Stay in the range)
-Strong break but return into the same range (To get rid of all buyers)
-Strong break with volumes and the formation of the right candle stick afterwards for a new long entry.
- Beware of the support line which still stays another possibility if it keeps ranging
Timing:
- If already in the market in the long direction exit at the top blue line or the next red candlestick.
- Strong probability to see the top level reached: beginning of next week.
DX1! trade ideas

DX what to do with my cashThis may be the most important chart for me in the big picture sense because I will use it's cues to help me decide if my dollars are safe or if I need to protect against inflation now. This chart shows the dollar is either going to pop or drop, hell maybe both(we already had one fakeout to the upside). My feeling is that we are first in for a major deflationary cycle where asset prices will plummet across the board due to lack of demand. No amount of money printing can change that.....or can it?
I guess I could also see stocks blasting off due to massive inflation that is occurring. But I think this phase of "maybe we're out of this pandemic soon" is going to come to an end when we start to see the widespread insolvency that is going to occur due to 30 million people losing their jobs. The need for dollars will be insatiable to pay down dollar debt all over the world. In this case I predict prices will plummet and the dollar will rise even as the Fed prints infinite money to counteract it. That's where my money is for now, long dollars.

Dollar Index ~ Poised for rallyMarket structure suggest USD Dollar index poised for good rally towards 110 and 115 in coming months.
El comportamiento del Indice del DolarRebote importante de un area de soporte y de vuelta al canal alciste con leve pendiente al alza

DX index 2020 year forecast by PowerfulTradersTraders we do not like to write more.
The prediction of the price you can find on chart!
Regards, Team Traders "Powerful Traders"

Dollar testing 100... and what ? Buy the dips should be higherHi Traders,
all the details recorded
Enjoy!

UD Dollar Making a Move Towards 100US #Dollar looks destined for a test of long term falling resistance at 100 and a push to rising channel resistance that began in 2018. It's reaction at that level will likely determine the longer term narrative. $USD $DXY

SMS Strategy - Long US Dollar EntryOur SMS Strategy went Long the US Dollar Index on 2/5/20. Current protective stops are 96.945 and will move up soon.

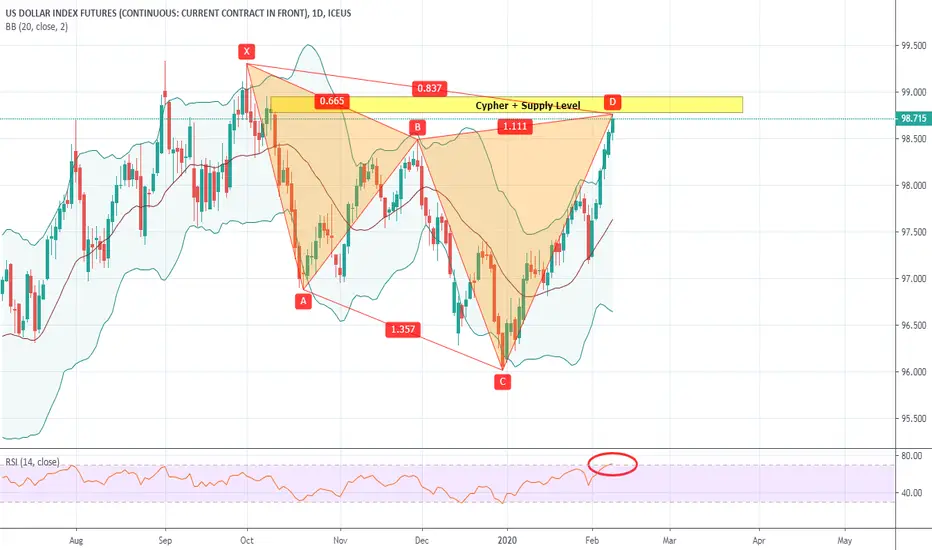
DX1! US Dollar Futures at Supply + Cypher patternUS Dollar futures at Supply + Cypher pattern + RSI overbought = Supports a short term EURUSD rally (See Shark Post)
The FXCM Dollar Index is lagging the futures (arbitrage CFD vs. Futures?) as it has not reached the supply level that is present on the Futures chart
Does not surprise me as CFD's are based on futures and are not the same animal
i put more faith in futures as they are exchange traded and represent exchange regulated contracts, so have a little more confidence in my EURUSD long trade just a small confirmation that the trade is agreeing with the USD
Dollar Index analysisThe chart is end-of-day, so updated at the close of December 31.
Today, at least for the moment, the dollar is recovering almost all the loss from the last session. At 7:10 (CET) the futures contract price is $96.37 with today's high of $96.43. It, therefore, seems to want to rebound on the bearish channel's support trendline. To try to reverse the bearish trend, it will be essential to go back above $96.50 and then above $97.00/97.25.
In this sense, we will have a general drop in raw materials but nothing alarming, especially grains and soft that had a bullish final part of 2019, and a rise in the dollar would coincide with a physiological bounce.
However, as long as the price remains within the channel, the trend will be bearish (waiting for the next FOMC meeting).


USD - Testing Rising Support for 4th timeImportant to be patient here with $USD. #Dollar has traded in this channel for 18 mos and is sitting at rising support which has been tested 4 times in that period. RSI not oversold
Bears should wait for break. Bulls should look for confirmation that channel holds. $DXY

The Dollar Is Creeping Up QuietlySince February 2018, a rally began in the Dollar Index which saw it move above the 200sma
in May of that year and continued until it reached a high of $97.53 in November 2018.
Price has been trending to the upside but it has been a slow gradual process,
moving sideways the majority of the time with the occasional breakout.
What helped and assisted price is continuing its ascent was the 200sma.
The decline in January 2019 saw price come close to the 200sma and found zonal support around
that area and continued to do so through to March 2019.
June to July 2019 also saw the 200sma being used as support and again in October to November 2019.
The 200sma has held price up for the whole of 2019 and may continue to do so as long as price can make it
through strong levels of resistance. The first area of resistance is the 3rd September 2019 high at $99.33.
Above this is the major $100 round number which price has not traded above since April 2017.
A break above this level should be followed by strong moves in forex currencies paired with the dollar.
Until this happens we will just have to stand aside and monitor the Dollar Index.
See below for more information on our trading techniques.
As always, keep it simple, keep it Sublime.

USD has more room to go upUSD's strength has been quite unexplainable due to the lower rates in the US now. Though some explain it as a safe haven move, seems investors don't mind the expensive USD to buy stocks. Currently price plays out very well the DB on the daily chart and is moving up nicely to its target. I would expect more strength for the near-term.

Short U.S. Dollar IndexLooking for Dollar Index to move towards 95.90 over the coming weeks which in turn will push Gold prices higher.


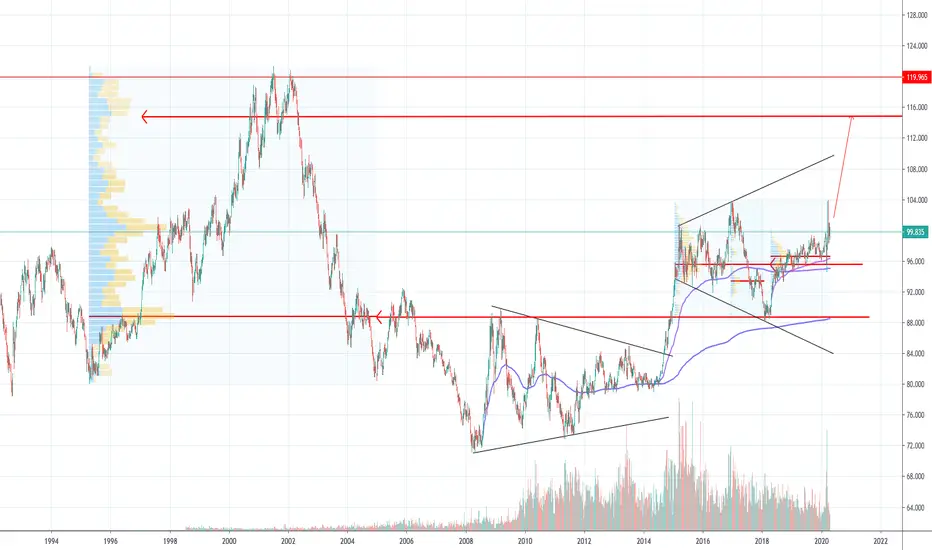
Where The USD is Heading & The Truth About China's Trade War!I know this may be a shock, but this long-term chart of the dollar suggests that the greenback may be setting up for massive gains in value, over the next 15 years or so. This chart is full of bullish formations. Let's start with the largest of the formations, which is the descending wedge (in black.) You can see that since these futures contracts went live in 1985, the dollar has been forming this massive descending wedge. That's nearly 35 years spent forming this pattern — amazing. In case you didn't know, descending wedges are bullish chart patterns, and the descending wedge here is enormous.
The next largest pattern is a massive cup and handle pattern (in blue.) So far, it is a textbook cup and handle pattern. You can see that price is inside of the handle right now, and could remain there for another year or two. What's even more interesting, is that the handle and the top of the falling wedge are converging in the same area. So, if price breaks out above the falling wedge, that will be a very bullish indication that the cup and handle could be setting up for a breakout as well. Now, if we look across the exact top of the cup and handle, we can see that it corresponds to a lateral resistance level at 104 (red dashes.) As you can see, that level has acted as major support and resistance in the past. So, assuming these bullish patterns break to the upside, we can expect powerful surges higher in response, since these levels have stood as resistance for so long.
The next pattern is the rising channel/wedge. I would say that this pattern is more of a channel than a wedge, but it is slightly closing toward the end. Regardless, it's rising to the upside, suggesting that price will continue to rise as it remains inside of that formation.
Assuming a breakout occurs from these patterns in the future, we can expect the USD to soar 40% or more in value. Obviously, that is contingent on a breakout, and the breakout hasn't occurred yet. A strong US dollar is good for US consumer purchasing power, but it isn't good for US companies who export products, or companies who conduct business overseas. So, it could have an overall positive effect, enticing companies to remain stateside.
However, some companies wouldn't have that option, if their business relies on foreign markets. This is why our response to China's trade war is critical. If the USD rises in the future, as this chart projects, we will need a stronger advantage in global trade, so that the US consumer can benefit while US companies are protected with trade renegotiations. Don't let the media lie to you, and tell you that America shouldn't be engaging China with tariffs. This isn't "Trump's Trade War," as the left would like you to believe. This is China's Trade War, which they started decades ago when Bill Clinton opened the doors. The only problem, is that no president has had the courage to respond, until President Trump took office. When America is under attack, we have an OBLIGATION to respond. The American economy has been under attack by China for decades. They've stolen our intellectual property to the tune of over $100 billion per year. They reverse engineer our products and sell billions in knock-offs in the global marketplace. They've polluted China and the world around them, by carelessly allowing companies to operate there without any regulatory costs or responsibilities, which enables companies to dump their waste products at random to save billions in regulatory costs that they would have otherwise paid in America. China artificially suppresses the value of its currency, so that it can take advantage of the US in trade expenses. Make no mistake about it, they've been executing a calculated attack on our nation for decades. When you go to the store, most products that you see are Made in China, and most of those products are made with toxic chemicals or otherwise do not meet US product quality standards. Yet, their products flood American markets, and every former president hasn't lifted a finger to stop it. Now that we actually have a president who understands the importance of this issue, and how dangerous it is for the future of America's national security, we have outrage from the leftists who wrongfully criticize Trump's response. I guess they would rather turn a blind eye, while the enemy quietly destroys us from the inside out. I am outraged and disgusted with Americans who don't have the courage to fight, when our country is under attack!
I'm The Master of The Charts, The Professor, The Legend, The King, and I go by the name of Magic! Au revoir.
***This information is not a recommendation to buy or sell. It is to be used for educational purposes only.***
-JD-


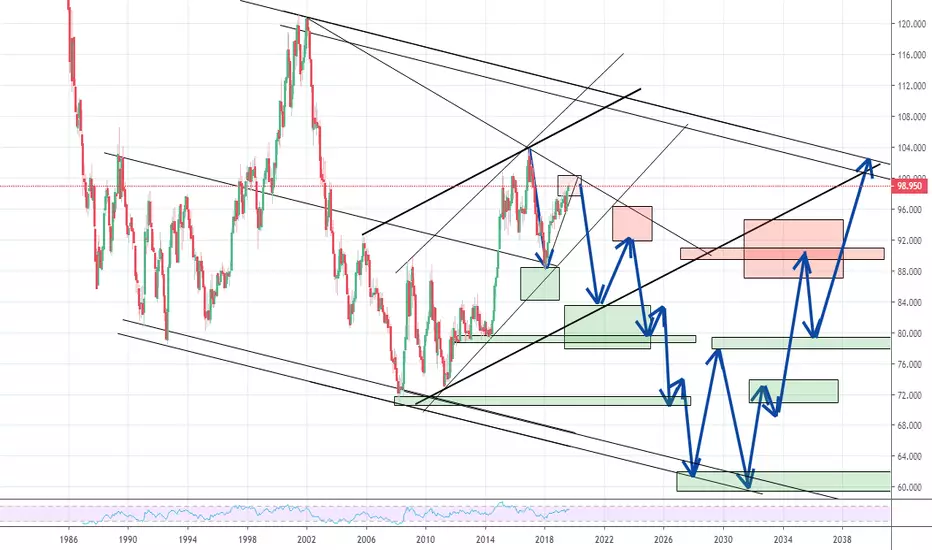
history doesnt repeat, only rhymes (potential scenario to come)this diamond pattern most assume would be a top, but in some circumstances, it can be a continuation. based on past instances of deflation my best guess would say this is a continuation. during periods of deflation currency/buying power increases due to falling prices and the incentive to hold for further falling prices. with global currencies weakening in response to lowering bond yields and a potential wait and see fed the dollar may get a nice kicker to unimagined heights. i firmly stand with the deflationary scenario similar to the 1980's pre-plaza accord. basically the japanese and US were competiting very similarly to the US and China today. the dollar got out of control until the plaza accord when global finance ministers/central bankers all met up and agreed upon a dollar devaluation (global reset). this is the scenario i'd look for and similarly to then i would look to Chinese stocks/back then thats when the Japanese bubble went crazy insane.
so
1) let the deflation narrative/dollar run high
2) global reset via finance ministers/CB's devaluing the dollar
3) buy chinese stocks and let the bubble (hyperinflation in china) go beyond what's sustainable

is the fomc about to make a drastic liquidity mistakeall relates to interest differentials and the cross currents of the need to print before the clock runs out. as we've seen china is loosing control of the currency. when their currency weakens their peg partners strengthen... that being said when you weaken your currency you import inflation, however you export deflation. if we dont make drastic moves to weaken in a material matter we may see the dollar make a major run due to its scarcity. this end game is likely to result in a break up in the sino-american debt loop. lets just hope our ppl make material measures to lean dovish/expand the money supply
king dollar going turbo.. china about to devalue again?turbo-tastic.. some traditional pairs may decouple. precious metals in particular will follow face value of bond rates rather the path of the dollar