AD showing a Double Top but base buildingDX, focusing on the AD & Money Flow. I see a double top by the AD, however there is a base forming. The Handle is currently being shorted, we dont have a bullish/bearish breakout yet. However, i'm leaning towards the bearish side based on what i've seen in Gold & Oil charts. I will be posting additional charts to show til there is a definitive trend direction
DX1! trade ideas

Bigger FlatGreetings everyone,
I hope you've had a productive week with successful trades. I wanted to share some of my ideas on the Elliott Wave Principle. It's crucial to make informed decisions and exercise patience in all transactions.
As per a quote from (J.F.), a professional analyst of the Elliott wave principle, amateur traders tend to focus on the possibilities that may happen while professional traders focus on the possibilities of what is happening.
My recommendation is to bear in mind that, after making a trade, the primary responsibility of the trader is to minimize risk, eliminate it, and ultimately preserve the profits earned.
Thank you for your continued support, and I'm excited to continue our journey together.
Sincerely,

Dollar - Slump Engulfed, Next Wave Up?Just as we looked at the previous last August correction, the question was; can a more impulsive wave engulf the slump, and it did to then print the next wave up.
Now the same thing is happening again.
Dollar did look quite impulsive with the bearish slump, but on Friday it printed a hammer and now today its having a very big pump that has easily engulfed the slump with even more impulsive action.
Still 6 hours until the current day candle closes but currently this is printing a very bullish Evening Star Candle formation.
And so this is more likely another wave up.
Remember that these Fibonacci Golden Window bands are not only to find reversals but also continuation patterns and this 1:0.618 GW may now prove to be a landmark for the latter.
The big blue band above is the long term retracement GW with pivots taken from 2022 top to 2023 bottom.
As we looked at before, that is the next obvious reversal point and if it slightly overshoots the extension 1:1 then it can reverse in both the extension GW and the blue long term 0.618 GW.
In terms of Fibonacci that is the most likely reversal point around $108.5 and slightly beyond.
That said it hasn't yet made significant price discovery past the local high and so if another slump comes and we have overlapping highs then it could yet be a top.
But for that to happen any bearish action would have to be very high volatility to match this bullish move.
Its interesting as "Craig" pointed out that there hasn't been a negative reaction in stocks or crypto which even had a nice pop today.
I think perhaps this is where those markets are becoming bullish now and they are leading the dollar in preparation for it topping.
So perhaps we may see some fireworks when it does actually top.
Also interesting that Gold and Silver are dumping hard but Palladium is holding well.
These are all probably clues of what will happen in the next market phase 🧐.

DXY up to 108 !!!Dollar Index is going to make huge gains in few next days, Technically
The price will go up from 105.8 to 108
Support 105.8
Resistant 108
While Gold,BTC and WTI are going to make some loses.
Wish you best trades


Update: DX! Long - bounce off support continues As previously discussed on Sept 6, bullish trend continues. Vertical price objective of 112.25

#DXY #F.US.SFX On Correction WatchIn this update we review the recent price action in the dollar index and identify the next high probability trading opportunity and price objectives to target
PAST PERFORMANCE NOT INDICATIVE OF FUTURE RESULTS

#DXY #F.US.SFX The Set Up Into The FOMC DecisionIn this update we review the recent price action in the Dollar Index and identify the next high probability trading opportunity and price objectives to target
PAST PERFORMANCE NOT INDICATIVE OF FUTURE RESULTS

THE USDThe US Dollar has broken the bearish trend line and broke two previous highs. This may lead to a change in direction towards 110.265-110.920 if it can successfully break 105.840 and retest it. The red lines mark potential reversal prices but should not necessarily indicate a change in direction.
Please, don't follow my signal blindly, trade based on your own risk.

EX FlatGreetings everyone,
I hope you all had a successful week with profitable trades. I am pleased to share with you my ideas created through the application of the Elliott Wave Principle. It is important to make informed decisions and exercise patience in all your transactions.
Please refer to the chart for relevant details.
I am grateful for your ongoing support and look forward to our continued journey together.
Respectfully yours,
(Mr. Nobody)

#DXY #F.US.SFX Looking To Fade Initial Test Above 105.50IN this update we review the recent price action in the Dollar Index and identify the next high probability trading opportunities and price objectives to target
PAST PERFORMANCE NOT INDICATIVE OF FUTURE RESULTS

DXY Futures DX1! ~ Weekly Swing ChartChart mapping/technical analysis of ICEUS:DX1! for developing long-term Swing Trade strategies.
ICEUS:DX1! TVC:DXY AMEX:UUP AMEX:UDN

DXY Futures DX1! ~ Weekly Swing Chart V2Update: same chart, same timeframe, wider view.
Chart mapping/technical analysis of ICEUS:DX1! for developing long-term Swing Trade strategies.
ICEUS:DX1! TVC:DXY AMEX:UUP AMEX:UDN

DXY Futures DX1! ~ 4hr Intraday ChartChart mapping/technical analysis of ICEUS:DX1! for developing short-med term Intraday Trade strategies.
ICEUS:DX1! TVC:DXY AMEX:UUP AMEX:UDN

DX - US$ Index on the way to the Center-line.In previous posts I already showed how DX is moving towards the CL.
It failed two time, then they cleaned out the Stop/Losses and now DX is on it's way to the Center-line.
Now that we have good confirmation, it would be a no brainer to load the boat even more on a pullback at the CIB line. (yellow).

DX1! - Dollar Index at equilibriumSo, here we have the USD Index at the Centerline at a balanced level.
What if the US$ starts go north?
I would say, markets, which are btw. also totally overbought, are tanking.
This scenario is on point with the CPI today.
Obvious or a fluke?
As always, anything can happen, even a new spike in the Indexes.

DX! LongDollar has entered long term bullish territory for the moment. Look to enter on pullbacks to support.

#DXY #F.US.SFX Two Way Trading Opportunities IN this update we review the recent price action in the Dollar Index and identify the next high probability trading opportunities and price objectives to target
PAST PERFORMANCE NOT INDICATIVE OF FUTURE RESULTS


DXY 2h 2023, 3d chartThe DXY chart for the next few months.
Retesting previous support, curving over the 3d 50sma, under the 3d 100sma the fate of the market rests on dollar price action.
The dollar's fundamentals don't need to be bullish for this to move up. The dollar's fundamentals just need to be better than other countries' currency fundamentals. With the CNY being devalued, this is gonna get interesting.

Dollar extended to the upsideDollar can now be seen as extended on the daily chart. Momentum towards the upside is too strong and not sustainable and a stall in price will likely happen soon and if lucky, a retracement.
Short opportunity: At market as High Risk trade targeting 102.875 as Take Profit - 1 level

US Dollar Index Could Be Topping HereSee the three touches on the upper trend line. If this line holds, the DX price could move down to the 98 area. Also the RSI (10) is overbought.
Such a chart could be used to short the DX, or to go long the EUR/USD and the precious metals such as gold, silver, platinum.
If I were to trade the DX short, I would place an extra big stop loss, maybe at 103.90 or at 104 (maybe even higher) in case of some stop hunting/a shake out before a big move down. Then would carefully add on to a profitable position. Same for going long the other choices: use a big stop loss.
(A strong close above the upper trend line would not be good for this trade; a peek-a-boo move that does not actually close above the trend line means the trade is still viable. Also, a daily close below the 103 area would help confirm this trade idea.)
Good luck!

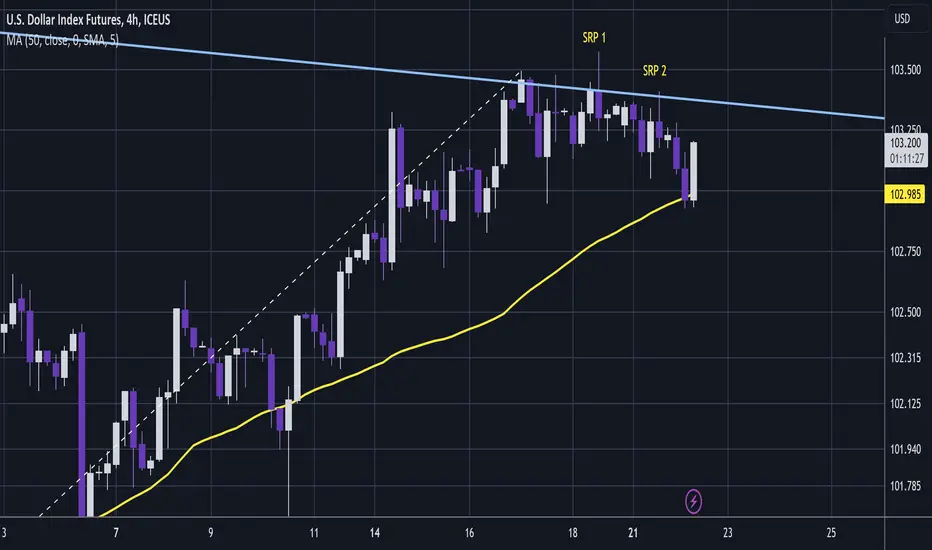
DXY - Downtrend Could Be Underway 🧐Had been showing what looked like strength pushing up against the Supply Trendline and threatening to break through, but now it has peeled and down, and it looks like a downtrend may have begun.
Notice how SRP 1 is the end of the bullish phase, but more importantly SRP 2 re-tests the supply trendline.
That wicked re-test is so often a big clue that a reversal is underway.
It is bouncing here and we will need to see if the bounce is a connective wave to then break down and through the 4H 50MA to continue the downtrend 🧐.
If it does fall then this can potentially be good for stocks and crypto 👍.