Dollar Index (DXY): Important Bearish BreakoutThe Dollar Index has fallen below a key daily/intraday support level,
which has now become resistance.
A bearish trend is likely to persist, with the next target set at 98.15.
Related indices

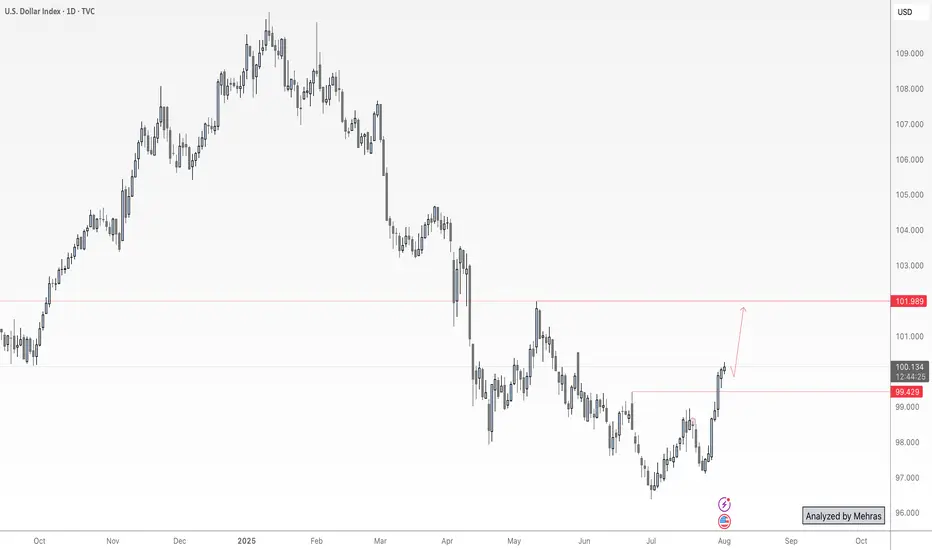
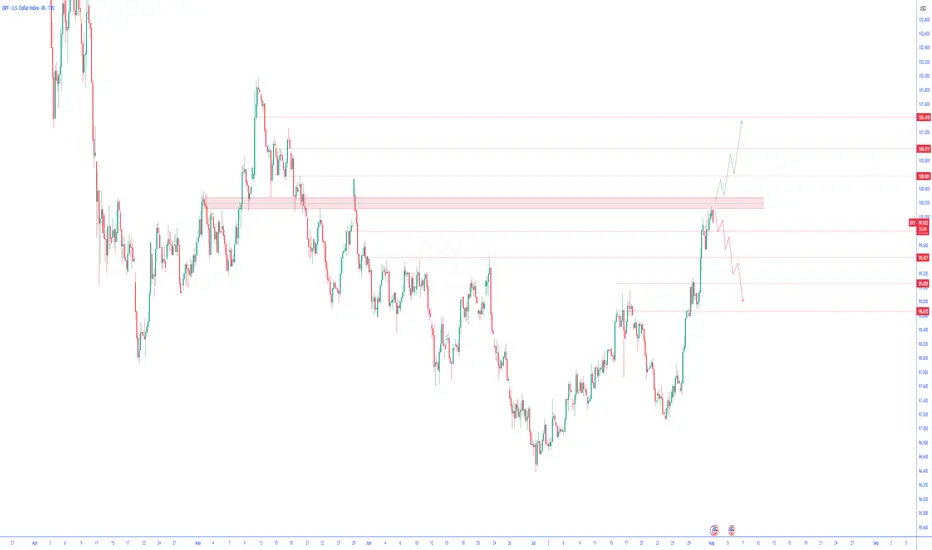
DXY Just Broke Through the Lock… Where’s the Market Headed Now?🌅 Good Morning, Friends!
A few days ago, I marked 98.950 as a key threshold for the DXY index. As of today, that level has officially been broken—and the bullish momentum we anticipated is now kicking in. 📈
The next target? 101.000.
That said, it’s crucial to remember: DXY is heavily influenced b

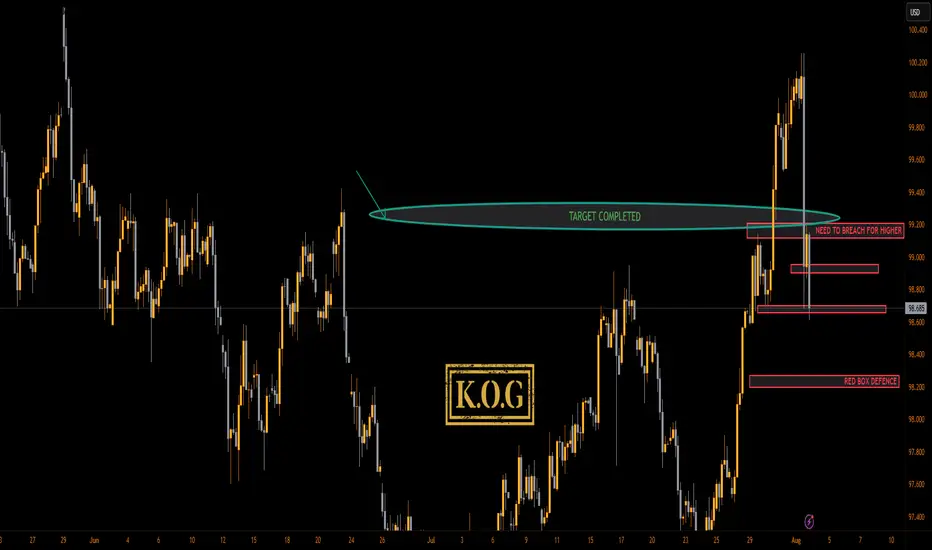
KOG - DXYDXY
As we can see here we've hit and breached the target level we gave a few weeks ago on the dollar. We're now at a red box level that can cause a temporary tap and bounce unless it's broken, so we'll keep an eye on this.
As always, trade safe.
KOG
NFP Volatility Ahead – Is the Dollar Ready to Break Higher?🟢 DXY Outlook – A Key Day for the Dollar Index
Yesterday’s monthly candle closed with strong bullish momentum, marking a powerful start to August. Today, on the first trading day of the month, we’re expecting three major U.S. economic releases:
NFP, Average Hourly Earnings (m/m), and the Unemployme
3rd August 2025 Daily Analysis For DxyDAILY DXY ANALYSIS FOR 3RD AUGUST 2025. Looking to see this setup play out completely on DXY . Will be focused on selling Gu and EU when the DXY setup start playing out

Dollar Index (DXY): Will It Rise More?!
Dollar Index is on its way to 100.4 resistance.
A breakout of a major supply cluster on a daily after FED meeting
yesterday indicates a strong bullish pressure.
I think that growth will continue soon.
❤️Please, support my work with like, thank you!❤️

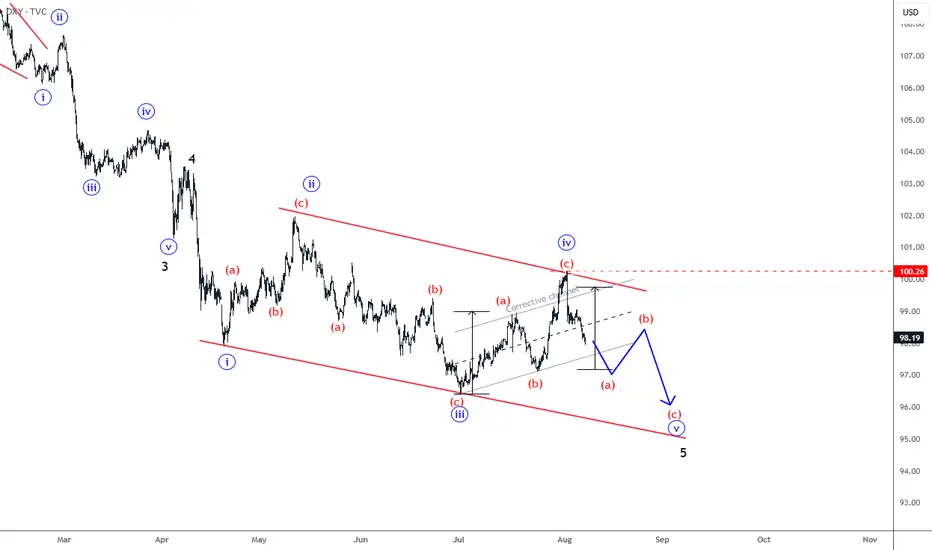
DXY Is Still Bearish; Final Leg Of The Wedge Pattern?DXY Is Still Bearish, but it can be trading in final leg of ending diagonal a.k.a. wedge pattern from technical and Elliott wave perspective.
US Dollar Index – DXY made only a three-wave rise from the lows, which indicates for a correction within downtrend. So recovery can basically still be a fou
Bullish on The US Dollar Currently short term bullish on the dollar until it gets to the orange box. A retracement lower to accelerate the move higher is permitted. Let's see how this unfolds in the coming weeks

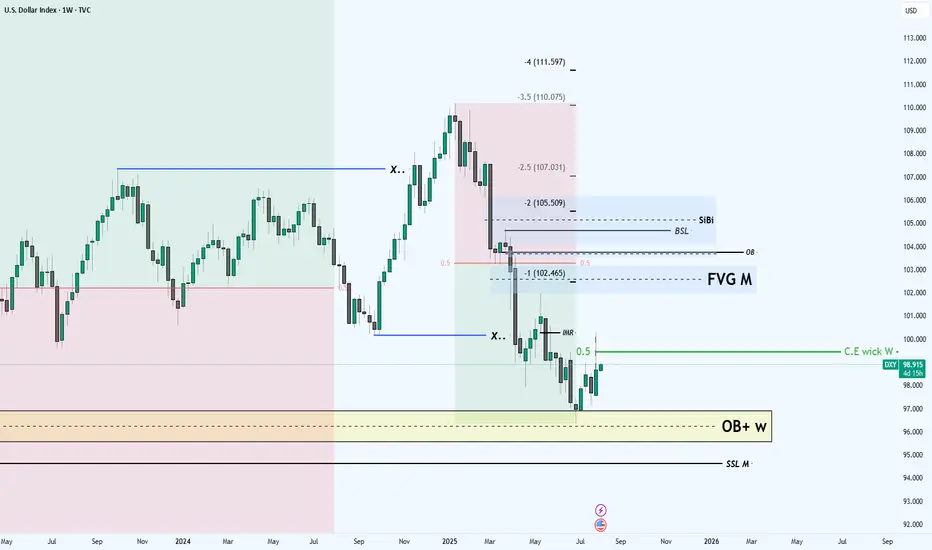
future of the DXYHi to every one
In the DXY we are in the middle of the decisioning area which means
we should wait for the market to show its hands
First sensitive level that i am looking for is the C.E of the weekly candle(Prev.week)
IF we get resistance at that level we can wait for the price to dee
U.S. Dollar Index (DXY) Technical Analysis – 4-Hour TimeframeU.S. Dollar Index (DXY) Technical Analysis – 4-Hour Timeframe
Following yesterday’s economic data from the United States, which included stronger-than-expected GDP growth and consumer confidence figures, the U.S. Dollar Index (DXY) has continued its upward trend with strength. These developments ha
See all ideas
Summarizing what the indicators are suggesting.
Oscillators
Neutral
SellBuy
Strong sellStrong buy
Strong sellSellNeutralBuyStrong buy
Oscillators
Neutral
SellBuy
Strong sellStrong buy
Strong sellSellNeutralBuyStrong buy
Summary
Neutral
SellBuy
Strong sellStrong buy
Strong sellSellNeutralBuyStrong buy
Summary
Neutral
SellBuy
Strong sellStrong buy
Strong sellSellNeutralBuyStrong buy
Summary
Neutral
SellBuy
Strong sellStrong buy
Strong sellSellNeutralBuyStrong buy
Moving Averages
Neutral
SellBuy
Strong sellStrong buy
Strong sellSellNeutralBuyStrong buy
Moving Averages
Neutral
SellBuy
Strong sellStrong buy
Strong sellSellNeutralBuyStrong buy
Displays a symbol's price movements over previous years to identify recurring trends.
Frequently Asked Questions
The current value of U.S. Dollar Currency Index is 98.276 USD — it has risen by 0.08% in the past 24 hours. Track the index more closely on the U.S. Dollar Currency Index chart.
U.S. Dollar Currency Index reached its highest quote on Nov 8, 1985 — 129.670 USD. See more data on the U.S. Dollar Currency Index chart.
The lowest ever quote of U.S. Dollar Currency Index is 70.698 USD. It was reached on Mar 17, 2008. See more data on the U.S. Dollar Currency Index chart.
U.S. Dollar Currency Index value has decreased by −1.53% in the past week, since last month it has shown a 0.94% increase, and over the year it's decreased by −4.54%. Keep track of all changes on the U.S. Dollar Currency Index chart.
U.S. Dollar Currency Index is just a number that lets you track performance of the instruments comprising the index, so you can't invest in it directly. But you can buy U.S. Dollar Currency Index futures or funds or invest in its components.