DXY July 6 AnalysisDXY
July 6
Parent Bias Bear
WEEKLY ANALYSIS
*Good example to witness price trend for the second week-the pull back I was anticipating did occur just not to the level I had suggested in last Sundays journal
*Note Price wicked to the .70 level on the monthly
*Price took key equal lows and rebalanced a FVG from Feb 22
*Monday/Tuesday Price seek lower prices
*Mid week consolidation-expected
*Thursday price took equal highs I was anticipating
*Friday Asia
*PM session of NY price retraced to close in consolidation
*Thursday expansion to buy side then on Friday reversal
WEEK AHEAD IDEAS
*Price closes in a consolidation on the previous days range 50%
*I suspect that price could seek the minor equal highs/FVG potentially reach for the gap from Thursday possible target should it really expand - this could be Sundays delivery
*could price expand for higher prices beginning of the week
*No news until Wednesday
*Sundays delivery can affect my ideas stay open
DXY trade ideas

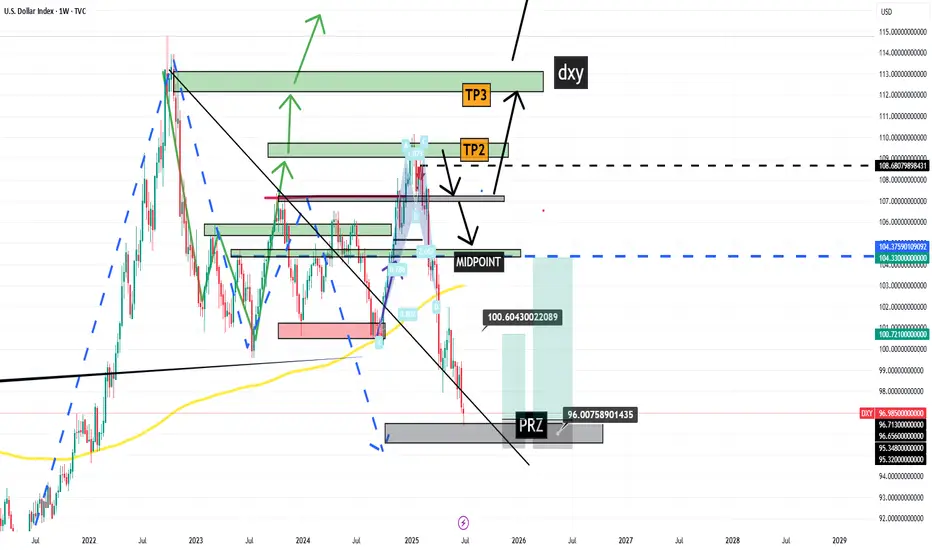
DXY Potential Bullish Reversal – Target 99.456 DXY Potential Bullish Reversal – Target 99.456 🎯
Technical Analysis Overview:
🔹 Trend Structure:
The chart illustrates a recent downtrend, which has been broken as price moved above the descending trendline, signaling a potential trend reversal.
🔹 Pattern Insight:
A bullish harmonic pattern is visible (possibly a bullish Bat or Gartley), with the price reacting from the PRZ (Potential Reversal Zone), aligning with key support near 96.500. The market has respected this zone multiple times, evident from the orange highlighted circles showing price rejections.
🔹 Support & Resistance:
Support Zone: ~96.500
Breakout Zone: ~96.985 (current consolidation near this resistance)
Target Zone: Marked at 99.456, which aligns with previous structure and fib projection.
🔹 Market Sentiment:
Price is consolidating after breaking the downtrend, forming a bullish rectangle (accumulation). The green arrows indicate bullish intent from buyers defending support levels.
🔹 Price Action Signal:
Formation of higher lows.
Break of structure and close above previous highs.
Possible breakout pending above consolidation box.
📊 Conclusion:
DXY shows bullish potential as it builds a base around strong support. A confirmed breakout above the rectangle could fuel a rally toward 99.456. Keep an eye on volume and confirmation candles for entry. ✅

BULLISH ON DXYSince I'm bearish on bonds, I am bullish on the DXY.
I would like to see that 4-hour order block hold and DXY attack the buy-side.
However, I’m open to the idea that we could take out the sell-side liquidity first, then move to the buy-side.
Looking at EUR/USD, we do have equal highs, so perhaps EUR/USD takes out the buy-side liquidity before heading lower.

July 7 - 1th: Sell The RIPs, Buy The DIPs! (PART 1)This is Part 1 of the FOREX futures outlook for the week of July 7 - 11th.
In this video, we will analyze the following FX markets:
USD Index, EUR, GBP, AUD, NZD, & CAD.
Last Friday was a bank holiday, so the price action is discounted. This Monday has no red folders on the calendar, so the environment is set for a day of misdirection. Be careful to take only trades that confirm your directional bias!
USD is still weak, and analyst have determined the FED will put off cutting rates until September. Tariffs wars may start up again July 9th. And Trumps Bill can add 3+ trillion to the debt.
None of this supports the USD!
Look to buy the dips xxx USD, and look to sell the rips vs USD xxx.
Enjoy!
May profits be upon you.
Leave any questions or comments in the comment section.
I appreciate any feedback from my viewers!
Like and/or subscribe if you want more accurate analysis.
Thank you so much!
Disclaimer:
I do not provide personal investment advice and I am not a qualified licensed investment advisor.
All information found here, including any ideas, opinions, views, predictions, forecasts, commentaries, suggestions, expressed or implied herein, are for informational, entertainment or educational purposes only and should not be construed as personal investment advice. While the information provided is believed to be accurate, it may include errors or inaccuracies.
I will not and cannot be held liable for any actions you take as a result of anything you read here.
Conduct your own due diligence, or consult a licensed financial advisor or broker before making any and all investment decisions. Any investments, trades, speculations, or decisions made on the basis of any information found on this channel, expressed or implied herein, are committed at your own risk, financial or otherwise.


#Dollar / #Bitcoin correlation I've previously described the correlation, and it's clear to everyone: a weaker DXY is positive for BTC.
📝Recently, the dollar has grown significantly and seems close to a local maximum (the chart is inverted). This demonstrates the strength of Bitcoin, as it was able to rise even against a strengthening dollar.
💡Imagine its movement when the new administration plans to lower the dollar price like they did last time. I think we will see a similar scenario as in 2017, when the dollar, from a local maximum, begins to provide a tailwind to the movement of assets that trade against it.

DXY (Dollar Index) longs to shortsThe dollar has been bearish for several weeks, but we’re now starting to see signs of a potential retracement due to price being in oversold territory. Last week, DXY reacted from a key weekly demand level, suggesting that we could see some short-term bullish movement before any continuation to the downside.
I’ll be watching closely for price to either push higher into liquidity or retrace slightly deeper into more discounted demand zones for a cleaner long setup. This would also align with my short setups across other major pairs, making DXY strength a key narrative this week.
Confluences for DXY Longs:
DXY has been bearish for an extended period — now showing signs of accumulation on higher timeframes
Price may retrace upwards to collect liquidity before continuing its macro downtrend
Recently reacted from a major weekly demand zone
Imbalances and liquidity above, including Asia highs, remain untapped
P.S. If price fails to react from any of my current POIs, I’ll patiently wait for new zones to develop and adjust accordingly — always staying aligned with what price tells us.
Let’s stay sharp and crush the week ahead!

DXY Is Bearish - But A Retest is Highly ProbableThere is no denying that the overall trend is still bearish. However, price is currently respecting an H4 demand zone - which might continue to apply pressure to the upside for a minor correction.
Of course, if this correction does not happen and the H4 demand zone breaks, then we continue to ride the trend to the downside and all the way to the next weekly TF demand zone.
#TheTrendIsYourFriend

Relation between DXY BTC TOTAL#📄 Analysis of three price charts and comparison between dates and movement
◀️ So far, the anticipated rise in alternative currencies has not occurred, and the rise that has happened is considered small and weak since the bottom of 2022
📄 In the first price chart, we see the movement of the US Dollar Index (DXY)
🔽 Each time the index breaks below the 100.00 level, it has a path to test 90.00, and this path has been achieved twice before during the periods of 2017 - 2018 and 2020 - 2021, with each time lasting approximately 320 days
◀️ At the moment we are in, there has been a break below the 100.00 level in DXY, and we are currently on day 84 of this break
⭕️ In the first break between 2017 - 2018, Bitcoin moved up by 2128%, and alternative currencies moved up by 3030%
⭕️ In the second break between 2020 - 2021, Bitcoin moved up by 608%, and alternative currencies moved up by 1668%
⭕️ In the current third break, which is still in its early stages, Bitcoin has moved up by 48%, and alternative currencies have moved up by 23%
⌛️ This period may extend into the first quarter of 2026, and it is essential to monitor developments closely with daily and weekly follow-ups

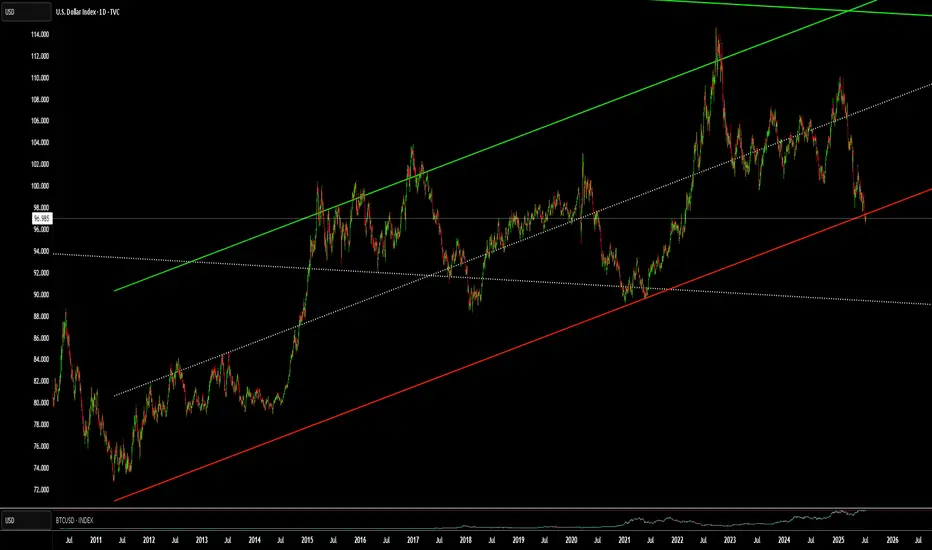
WHy is everyone Freaking out over the DXY !?!?!Here is a chart of the DXY. with a linear regression channel plotted over it. Yes, we are close to the bottom of the channel. But we are no where near an all time low. Far from it. The DXY may be due for a push, but even if it was to drop more it would not be that big of a deal relative to historical patterns.
USD Index preparing for fresh YTD lows?As shown on the daily chart of the USD Index, the currency has been biased to the downside for most of this year and recently met with 1M support at 96.80. This has caused the Index to modestly rebound and retest a 6M resistance at 97.39. Given this level's significance and trend direction, sellers could show from 97.39 and refresh year-to-date lows towards 1Y support at 95.67.
- FP Markets Research Team

FOLLOW THE TREND The DXY is showing signs of a momentum shift, transitioning into a bullish recoup as Q2 progresses. This shift may signal a change in broader market sentiment, with the dollar seeking strength amidst evolving macroeconomic conditions. Traders should watch for confirmation at key structural levels. follow for more insights , so you can make informed decisions ,comment for opinions , and boost idea

DXY IS BULLISH, SELL EURUSD, GBPUSD, WANNA BET?My last publish about dxy was stopped out but that doesn't invalidate the trade. We will still see a bullish dollar and bearish EURUSD AND GBPUSD.
SL @ 96.775
TP 1 @ 97.620
TP 2 @ 98.285
TP 3 @ 99.420
Use this trade to learn compounding and grow your account. Dont just take 10 pips and run off, once in profit,add more at a discount prices. The TP is certain
Enjoy
Follow me as my trades are market order, so you will see them on time and enter on time.

Dollar about to lose 35% of its value in the next 5 yearsDXY testing its last support line before the slide into a steep value crush.
What's another 5 trillion added to the debt anyway? Billionaires need more tax breaks!

US DOLLAR: Sell opportunity following channel breakPrice on DXY recently broke above a sharp descending channel, but the move lacked presence. There was no real follow-through and certainly no conviction behind the candles. It felt hesitant, as this is a great indication for us to use.
Instead of accelerating upward, price now hovers just above the breakout, this kind of behavior suggests rather a random push than a shift in sentiment. Without the strength to sustain above structure, I think we will see the price come back to the channel's lower border.
And when breakouts fail, they often trap early longs, preparing for a more committed move in the opposite direction.
A rejection from this level could send price into the 0.85800 level.

Dollar Testing The Channel Support It’s already Friday and the 4th of July, so US holidays are here, which means we could see thinner trading conditions later today. Still, the overall tone remains risk-on since yesterday, supported by better-than-expected Non-Farm Payrolls data and an ISM services reading at 50.8—still in expansion territory. So, there’s some optimism in the market, and this could continue if we get a positive outcome on the tariff front ahead of the July 9th deadline.
On the back of strong economic data, US yields are moving higher, but the Dollar Index is trying to come lower. It’s currently retesting the lower trendline of a corrective channel—likely due to the strong rally in US stock indexes, which are keeping the dollar under pressure.
On the daily chart, the Dollar Index still looks like it could head to new lows, but that move may not come today if holiday conditions slow down the market. We might have to wait until next week for a clearer breakout.
GH

DXY making a bullish moveDXY seems to be making a bullish counter trend reversal to pick up liquidity after breaking @100.00 on the monthly/weekly times being bearish for sometime.
-This may be a move to the upside for 1-2 weeks picking up orders/momentum in order to continue its Bearish move gaining enough momentum to break below current monthly support.

DXY Weekly Projections (Big Beautiful Bill)Projecting that the fundamentals of the Big Beautiful Bill may increase the value of the US Dollar for a short time. The dollar will bounce to $99 then back bounce back to lower then $97.

Could we see the price rise from here?US Dollar Index (DXY) has bounced off the pivot and could rise to the 1st resistance which is also a pullback resistance.
Pivot: 97.10
1st Support: 96.70
1st Resistance: 97.77
Risk Warning:
Trading Forex and CFDs carries a high level of risk to your capital and you should only trade with money you can afford to lose. Trading Forex and CFDs may not be suitable for all investors, so please ensure that you fully understand the risks involved and seek independent advice if necessary.
Disclaimer:
The above opinions given constitute general market commentary, and do not constitute the opinion or advice of IC Markets or any form of personal or investment advice.
Any opinions, news, research, analyses, prices, other information, or links to third-party sites contained on this website are provided on an "as-is" basis, are intended only to be informative, is not an advice nor a recommendation, nor research, or a record of our trading prices, or an offer of, or solicitation for a transaction in any financial instrument and thus should not be treated as such. The information provided does not involve any specific investment objectives, financial situation and needs of any specific person who may receive it. Please be aware, that past performance is not a reliable indicator of future performance and/or results. Past Performance or Forward-looking scenarios based upon the reasonable beliefs of the third-party provider are not a guarantee of future performance. Actual results may differ materially from those anticipated in forward-looking or past performance statements. IC Markets makes no representation or warranty and assumes no liability as to the accuracy or completeness of the information provided, nor any loss arising from any investment based on a recommendation, forecast or any information supplied by any third-party.

The bearish momentum is evident on the 1-hour, 4-hour, and dailyThe DXY is likely to continue its bearish trend until it reaches the 94.46 level—and it may even break below that

🇺🇸 Today's U.S. Data: Tariffs Starting to Bite?U.S. Data Journal – July 3, 2025
Today's U.S. economic releases showed a stronger-than-expected labor market, with Non-Farm Payrolls (NFP) surprising to the upside, alongside increases in factory orders and a solid ISM Services PMI print.
The combination of these indicators points to persistent demand strength across both goods and services. Moreover, the upward trend in factory orders and service sector activity suggests that tariffs are beginning to feed into cost structures, adding inflationary pressure from the supply side.
While the labor market remains resilient, the risk is that sticky input costs—partly tariff-driven—may complicate the disinflation narrative and potentially delay any dovish policy shift from the Fed.

DXY Quite IndecisivePrice on TVC:DXY after having broken below the Swing Low on June 12th @ 97.602 has created a lot of Indecision!
Starting with a 5 Day Long Consolidation period as a Rectangle Pattern
Then after the Bearish Breakout on June 30th due to the Federal Reserve mentioning possibly leaning towards Interest Rate Cuts, we see the TVC:DXY form a Expanding Range
Now at the Swing Low and above all the Consolidation or Indecision, we see a Volume Imbalance in the 97.5 - 97.6 area.
Fundamentally, USD has been mostly beating expectations with:
- Manufacturing and Services PMI's showing Expansion
- Job Openings higher then expected
- Unemployment Claims Low
- Unemployment Rate dropping ( 4.1% )
- Factory Orders Rising
Non-Farm Employment however hurt USD with -33K instead of the 99K forecasted
With all the Tariff uncertainties and how they will affect Inflation continues to worry markets with only a few deals having been ironed out, like the 20% Tariff on Vietnam ( down from 46% ) before the July 9th Deadline.
www.tradingview.com
Now with good Employment News out with numbers showing Strong Job Reports, this eases labor fears and could help remove some of the expectations of the amount of Interest Rate cuts this year.
www.tradingview.com
www.tradingview.com
