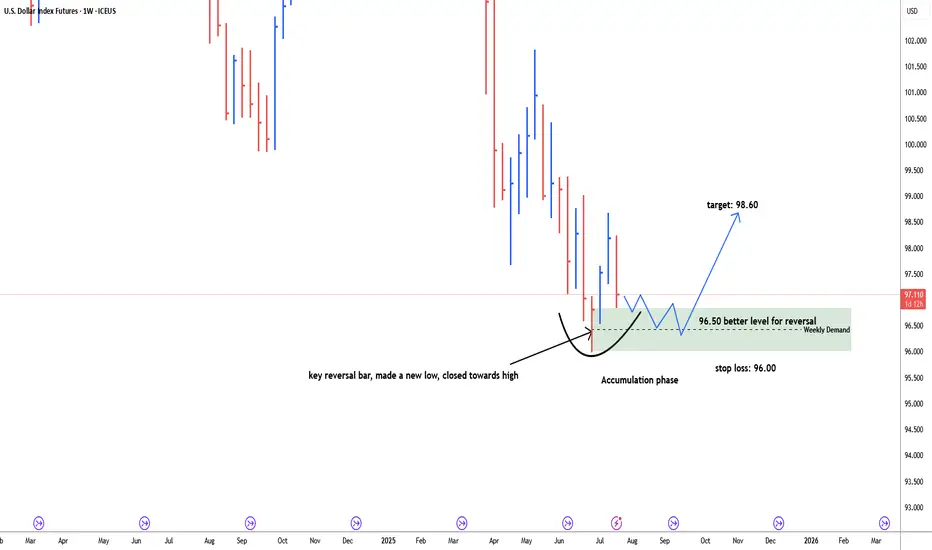
USD Dollar index possbile bullish reversal#usddollarindex, last weekly bar of the month of June is key reversal bar, made a new low and closed towards high. price retracing back down to test weekly demand zone. discount zone of demand is 96.50. possible bullish reversal target: 98.60. Stop loss below 96.00. price need time to build energy f
Related futures
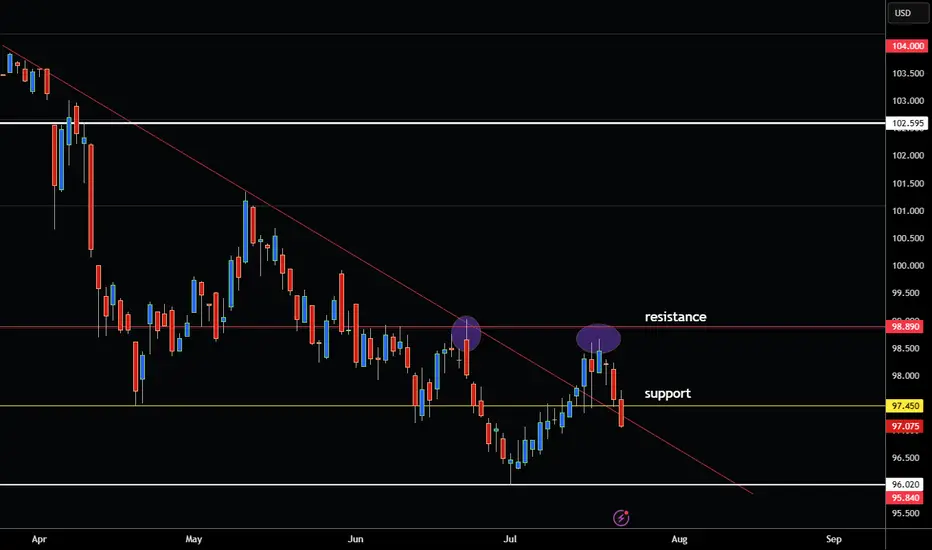
US DOLLAR INDEX BREAKING BELOW SUPPORT LEVEL RE-ENTER DOWNTREND! Hey Traders so today looking at the US Dollar Index or DX Market we can see that it has been in a solid downtrend since March. This is why alot of commodities and currencies have been getting stronger against it.
This is why I feel you don't need indicators to trade because price action shows you
Dollar Outlook – Bearish Trend with Key Support Levels AheadThe market is clearly bearish, and I do not recommend buying the dollar at the moment.
If the price breaks through the important zone between 98.525 and 96.725, we could see a move down toward the next zone between 95.935 and 94.790.
This lower zone is a key support level if it gets broken, the do

DOLLAR HIT LARGE DEMANDWe may hit the end of the bend. On the larger time frame, we see price retest the double bottom neckline. Last month price developed a doji a huge sign that price might be heading in the opposite direction soon. Fundamentally we see Smart money adding to their contracts and the candles are shortenin

Currency Pairs. Part 2. Weekly OutlookExpecting massive expansion on DXY and major meltdown on Euro and Pound

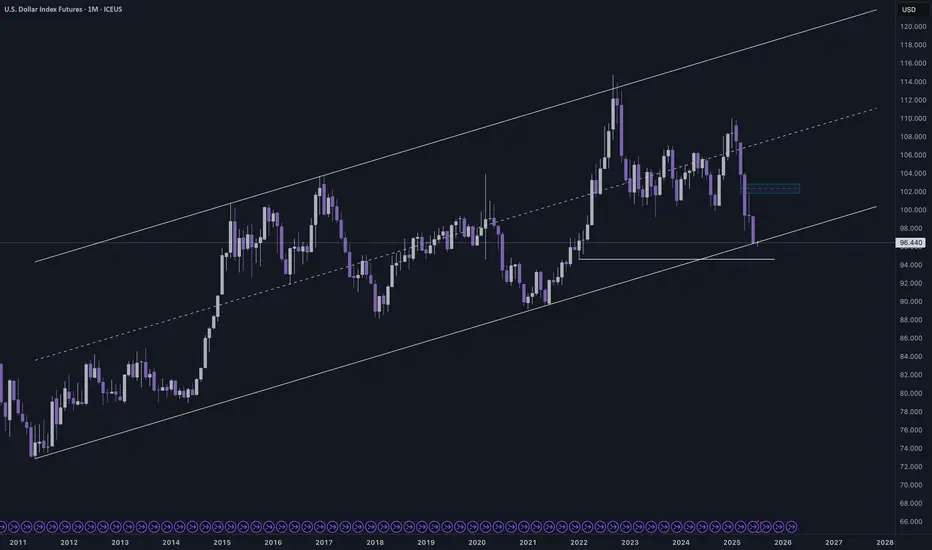
DX - USD Index Longterm Outlook Indicates Further DeclineThis long-term chart shows how the USD Index is trading within the boundaries of the Median Line set.
We see the lower extreme, solid support around the Center Line, and the upper extreme acting as resistance.
What’s next?
Well—if it’s not heading higher, it’s likely heading lower—and the rejectio

A Contrarian View On the US DollarI don't recall the last bullish headline I saw for the US dollar, bearish sentiment may be stretched, and I'm seeing plenty of clues across the US dollar index and all FX majors that we could at least be looking at a minor bounce. Whether it can turn into a larger short-covering rally is likely down

Is the US Dollar about to Rally?Hey traders just saw 3 bar trend line confirmed on US Dollar Index but is it actually entering a new uptrend?
Not sure no one knows of course fundamentally speaking I'm not sure. Seasonally it normally tops in the summer. But of course anything is possible in this new Tariff driven market we are in

Market Analysis For DXY: Week of May 26thFurther downside momentum looks like a strong possibility this week with liquidity and imbalances resting in short-term zones.

See all ideas
Summarizing what the indicators are suggesting.
Neutral
SellBuy
Strong sellStrong buy
Strong sellSellNeutralBuyStrong buy
Neutral
SellBuy
Strong sellStrong buy
Strong sellSellNeutralBuyStrong buy
Neutral
SellBuy
Strong sellStrong buy
Strong sellSellNeutralBuyStrong buy
A representation of what an asset is worth today and what the market thinks it will be worth in the future.
Frequently Asked Questions
The current price of US Dollar Index® Futures is 97.010 USD — it has risen 0.40% in the past 24 hours. Watch US Dollar Index® Futures price in more detail on the chart.
The volume of US Dollar Index® Futures is 44.00. Track more important stats on the US Dollar Index® Futures chart.
The nearest expiration date for US Dollar Index® Futures is Dec 15, 2025.
Traders prefer to sell futures contracts when they've already made money on the investment, but still have plenty of time left before the expiration date. Thus, many consider it a good option to sell US Dollar Index® Futures before Dec 15, 2025.
Open interest is the number of contracts held by traders in active positions — they're not closed or expired. For US Dollar Index® Futures this number is 679.00. You can use it to track a prevailing market trend and adjust your own strategy: declining open interest for US Dollar Index® Futures shows that traders are closing their positions, which means a weakening trend.
Buying or selling futures contracts depends on many factors: season, underlying commodity, your own trading strategy. So mostly it's up to you, but if you look for some certain calculations to take into account, you can study technical analysis for US Dollar Index® Futures. Today its technical rating is neutral, but remember that market conditions change all the time, so it's always crucial to do your own research. See more of US Dollar Index® Futures technicals for a more comprehensive analysis.