SB1! trade ideas

Sugar Futures Falling WedgeI think that the indicator I have developed is working really well in sugar futures. From this point of view and due to the fact that sugar futures have a wedge, I think that there is an initial upside potential of 7% and then if the wedge is broken, I think that sugar futures can go up to $23.

Sell July Sugar market on open, stop 19.09, tgt TBDDowntrend in Sugar picking up steam. Sell July Sugar market on open, stop 19.09, tgt TBD


sugar monthlySugar losing some more ground on the monthly chart.
The correction is deepening...
momentum breakdown

SB ShortSB has sell signal based on COT report. Also seasonal trend is down. Weekly trend changed from up to down trend. The daily trend is in a down trend. Currently we see correction. My plan is to use this correction to open a shot position. Usually I risk 2% per trade, but in a Drawdown to reduce the emotional pressure I reduce the risk to 1%.

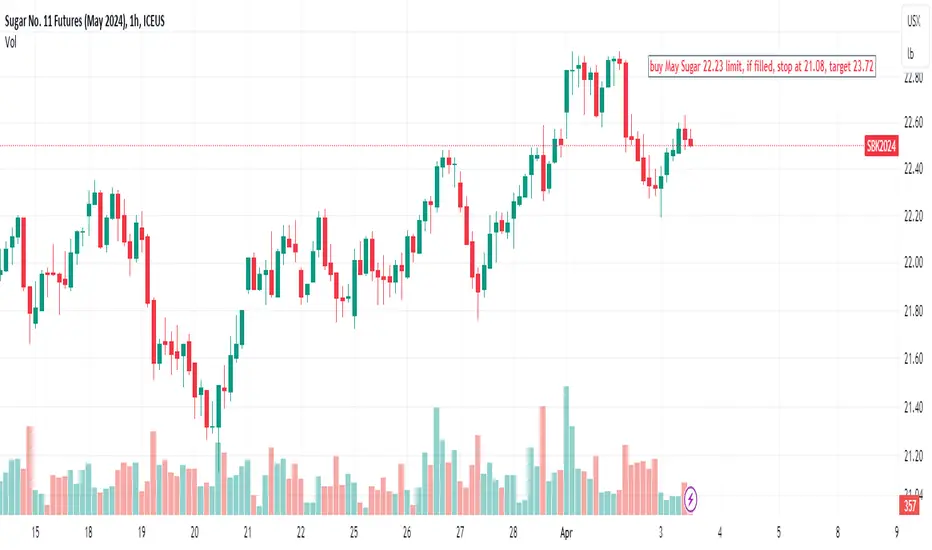
Buy May Sugar 22.23 limit, if filled, stop at 21.08, target 23.7Based on AI technical analysis, buy May Sugar 22.23 limit, if filled, stop at 21.08, target 23.72
Looking to buy May Sugar at 22.13, stop 21.54, tgt at 23.23Sugar is showing some recent strength and with Cocoa prices soaring we are looking for technicals to fuel short term rally. Looking to buy May Sugar at 22.13, stop 21.54, tgt at 23.23

SUGAR: Jan 30, 2024Returning to the current price action, I see an upward movement from the low of 20.01 to the current high of 24.59, unfolding in Three waves. The price action doesn't seem quite favorable; what I mean is that there appears to be one of the Fibonacci Multiple Relationships that is not clearly defined, and it doesn't follow the common Multiple ratios. However, in the Commodity market, as well as Metals, markets experience strong and rapid fluctuations.
Bottom line: Sugar may decline to a level lower before rising in wave 5. However, pay attention to the alternative wave count.
The big context suggests a Bear market, and the short-term outlook may rise higher, while the price remains above 22.50-22.98. A drop below this level indicates that the Bear market might be resuming.

SUGAR: Feb 7, 2024Analyst: Shane Hua (CEWA - Master Candidate),
Hi traders, today's forecast is on commodities. Well, commodities tend to experience rapid fluctuations, some of which bear similarities to Gold.
Previously, I forecasted that Sugar would decrease to a lower level, and it turned out to be accurate. If I remember correctly, my initial target was 22.98.
Now, I believe Sugar may have completed the fourth wave (blue), you know, the common retracement target for the fourth wave is 0.382. At least it seems to have a solid basis for completion, and I am expecting a rally to higher levels in the market. Yes, the low at 23.01 needs to hold firm; what I mean is that prices must consistently stay above it for my bullish view on Sugar to remain intact. Conversely, a drop below it indicates I was wrong, and then I will return to update my latest forecasts.
So, that's my forecast. Have a great time, goodbye my friends.

Sugar looks goodSugar looks good for a swing long, it bounced from a 5 year R1 level and untested demand zone.
I expect a retracement to R2 ( middle of range)

Sugar Futures Technical AnalysisSugar should find a temporary bottom around here as it comes into an upward trend line of support and runs into the 200-day EMA. If it were to bounce, there is some minor resistance at the $26.48 area. Otherwise, if that were to break, sugar would likely make a run to return to the highs. Now, if the 200-day EMA and the upward trend line were to break, there would be some minor support at $23.31, which most likely would lead to a small countertrend rally. Otherwise, the more significant support levels are down at $21.81 and $20.35.

Sugar futures Gan square on the price action and rsi. It’s really cool to see the fibs and gans get respected on the time part of the chart. (Any angle or verticals line= time)

Sugar: Knock Knock🚪The sugar price has now reached the upper border of the pink trend channel. It should now break through this line, as it should continue to rise significantly with the yellow wave b. We expect the high to be in the green target zone between USX 28.72 and USX 30.84, which will then allow for new declines.

Sugar, Silver and InflationIt really doesn't get more EPIC than this 50 year chart patterns!
We will see eventually see these in classical chart trading books...
Else, I'll have to write my own book!
#silver #sugar #inflation

Long March Sugar at Market, Sell Stop Loss 24.93; Target 26.97Technicals and chart patterns indicate a slow steady move higher in soft commodity March Sugar for duration 2 days-2 weeks.

NEW YORK SUGAR FUTURES: ST DOWNSIDE CORRECTION IS TAKING PLACEThe New York Sugar Futures continues performing as anticipated. The expected ST downside correction is taking place .

SELLSB1- Massive resistance, Two cypher pattern, Fib 1.272 and the RSI showing lower low indicates that the bulls are getting weaker.

NEW YORK SUGAR FUTURES continues performing as anticipated BUT..Sugar continues performing perfectly as anticipated. Wave 5 in progress but rally starts showing ST hesitation which might trigger a ST downside correction in the coming sessions.

Sugar Failed a possible breakout here.We are long a Sugar spread backed by the momentum of the outright to the long side test prior highs. So far we are not getting there. BUT levels are GOLD.

SUGAR continues performing as anticipated.5t wave in progressICE NEW YORK SUGAR FUTURES continues performing as anticipated. 5 impulsive waves with the 5th one in progress. The 5th wave will perform in 5 sub-waves.

Decoding Sugar: Unraveling its Economic Impact and InterconnectiSugar is undeniably more than just a sweet additive to our food and beverages. It's a global commodity, instrumental in shaping economies and triggering intricate financial behaviors. But what makes sugar a commodity? How does it interact with major economic poles like oil stocks or the inflation rate? Let's dive into the intricacies of sugar as a powerful market commodity.
At the core, sugar is considered a commodity due to its widespread use and significant economic implications. Predominantly used in the food and beverage industry, it is equally essential in non-food industries. For example, it is employed as a raw material in biofuel production. Additionally, it is used in pharmaceutical production and textile industries. Such multiplicity in application across varied sectors and geographic regions gives sugar its weight as a globally traded commodity.
But, how does sugar, a carbohydrate used primarily in our kitchens, interact with something as significant as oil or the stock market? This might seem perplexing. In financial terms, the price changes in major resources like oil or sugar often form a reflection of the economic health. The interaction of sugar prices with oil stocks, or the stock market in general, is due to commodity indexation where commodities' futures are directly linked to financial markets. Consequently, any fluctuation in the sugar prices implies broader economic changes, including in oil and stocks.
Delving deeper into sugar’s price behavior, a unique pattern makes itself apparent. It commences at a significant high, marking between $26 and $30, which aligns with wave B in the Elliott wave principle, a tool often employed in financial forecasting. A transition is projected - a substantial longer-term fall towards $9 that can be mapped out as wave C.
In accompaniment with the Elliott wave theory, the Fibonacci retracements offer further insight into this journey. Significantly, the 78.6 and 88 zones in the Fibonacci sequence gravitate as crucial focus points at this low. This dip can be translated into a sharp decline of approximately 70-75% - a striking transformation in the sugar pricing landscape.
In contrast, oil walks a different path. Post identifying the peak in the area above $90, a correction of about 50% is anticipated. These meticulously calculated principles not just trace the sugar price trajectory, but also invite us to peek into the strategic interplay between major economic players like sugar and oil.
Deciphering these shifts and understanding their significance is vital in appreciating the broader puzzle of the global economy and how sugar, as a commodity, subtly orchestrates it.
Now, what about inflation? This stealthy economic culprit has a grip on sugar prices. Sugar prices are subject to inflationary impacts, steering the price trends of this essential commodity. So, any rise or dip in sugar pricing is a strong economic indicator that can inform inflation-related forecasts.
Thus, the story of sugar as a commodity is complex, weaving into the fabric of global economy, touching industries far and wide, from food to energy production, from influencing inflation to oil prices and market stocks. The sweet crystals reaching us is but the tip of the iceberg in the intricate economic saga of sugar.
Sugar, without question, has a sobering influence on our global economy and daily lives. But, wouldn't it be intriguing if the sugar commodity, in its silent economic language, reveals our shared economic future? Only vigilant observation and comprehensive understanding can tell. Hence, decoding sugar is not just a necessity but an art with potential economic revelations. The bitter-sweet truth is, in the economic labyrinth, we're all part of this sugar story.
ChartScope is a reader-supported publication. To receive new posts and support my work, consider becoming a free or paid subscriber.
Technical Analysis Update - Not Financial Advice
It's important to note that the following insights are intended for informational purposes only and should not be construed as financial advice. We'll be examining key indicators, chart formations, and potential trends. Remember, making informed decisions requires a comprehensive understanding of the market landscape. Stay informed, stay cautious, and as always, this is not financial advice.

Long Dec Sugar at Market; Target 26.18; Stop Loss 24.54Global threats to production from El Nino weather and abundance of rainfall in top producing Brazil, coupled with rising demand for food and fuel production.
