Ice / Usdt GATEIO:ICEUSDT
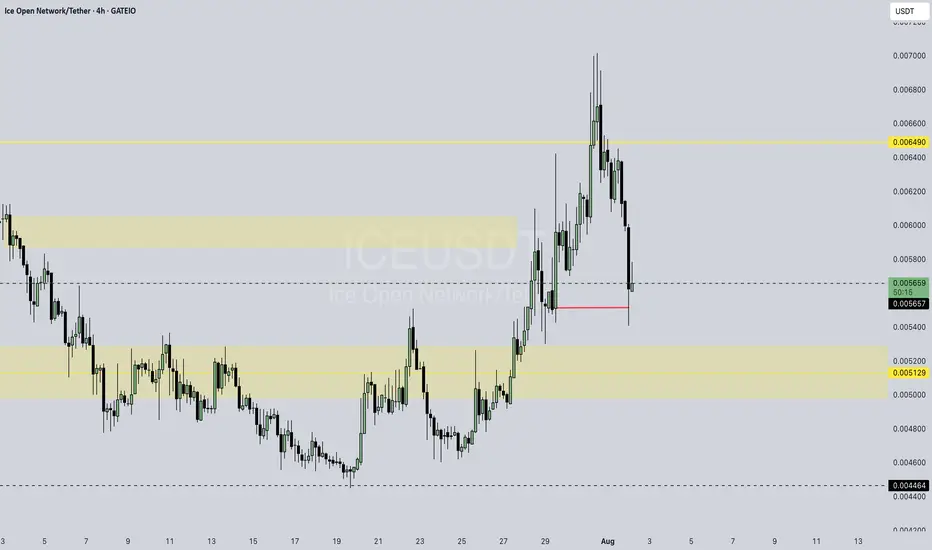
### 🔍 ICE/USDT — Key Levels (1H)
**📉 Recent Range:**
**\$0.00453–\$0.00512** — current consolidation zone.
#### 🔵 Support:
* **\$0.00453–\$0.00455** — intraday support.
* **\~\$0.00310** — older demand zone.
#### 🔴 Resistance:
* **\$0.00510–\$0.00512** — intraday ceiling.
* **\$0.00840**, **\$0.00925–\$0.00989** — long-term resistance.
---
### 📊 Summary Table
| Type | Price Range | Notes |
| ----------- | -------------------------------- | ----------------------- |
| **Support** | \$0.00453–\$0.00455 | Holding price currently |
| | \~\$0.00310 | Historical demand zone |
| **Resist.** | \$0.00510–\$0.00512 | Needs breakout volume |
| | \$0.00840+ / \$0.00925–\$0.00989 | Long-term resistance |
---
### ⚠️ Insights:
* Price is consolidating in a **tight zone (\$0.0045–\$0.0051)**.
* Breakout above or below may signal next move.
* Watch liquidity/volume around these key levels.
Disclaimer : Not Financial Advice
ICEUSDT trade ideas
Very Important Support And Resistance For ICEUSDT UPDATEThe price reacted well to all levels
But the price did not reach the levels of 0.008397 and 0.002671 and the price range of 0.009889 to 0.009252 to see how it will react to these levels.
But someday these targets will be touched.
when ? Time analysis will answer this question

ICEUSDT INSIGHT Buying off a demand zone that was previously rejected, looking to long at the price level 0.0031.
NFA, DYOR
Very Important Support And Resistance For ICEUSDTVery Important Support And Resistance For ICEUSDT Is Show In Chart

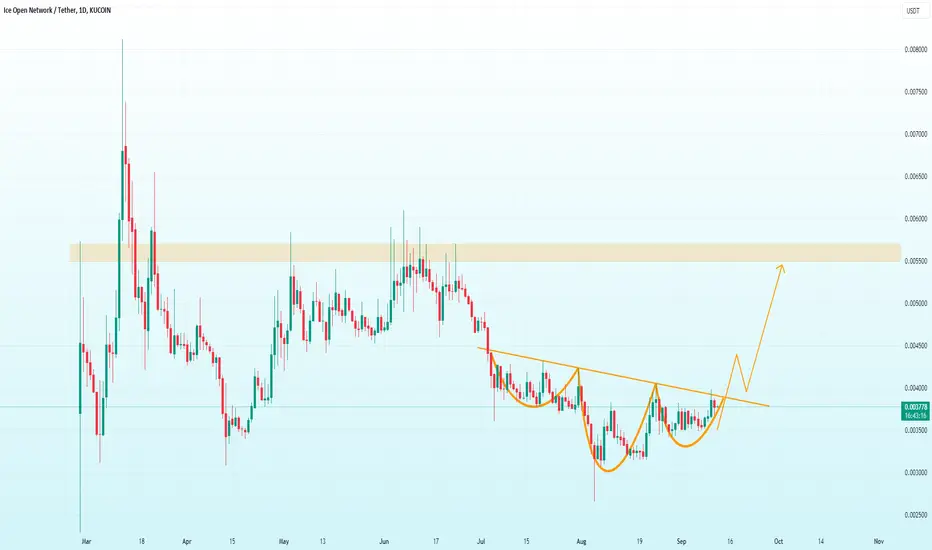
#ICEUSDT We see a beautiful chart
In addition, the blue pattern ceiling has also been broken
On the other hand, a beautiful cup and handle pattern seems likely
A break through the red resistance arrow would be ideal👀

Ice/UsdtOKX:ICEUSDT
**Ice Coin Overview**
- **Market Cap**: $39.5M 📊
This represents the total market value of all Ice Coin in circulation. It’s a key indicator of the asset's size in the crypto market.
- **24h Volume**: $10M 💵
This is the total trading volume in the last 24 hours. A higher volume usually indicates increased interest and activity in the coin, which could lead to price changes.
- **Fully Diluted Valuation (FDV)**: $126.32M 💎
FDV represents the total value of the coin if all tokens were in circulation. It gives a sense of the potential market value based on the total supply.
- **Total Supply**: 2.115B (2.115 billion coins)
This is the maximum number of Ice Coin that will ever exist. The current circulating supply may be smaller, but this is the cap for the coin's supply.
- **Current Price**: $0.005967 💰
This is the current trading price of the Ice Coin in the market. At this price, the coin is relatively low, and small price changes could have a larger percentage impact.
---
### **Resistance and Support Levels Explained**
- **Resistance**: $0.00600 📈
Resistance levels are price points where selling pressure is strong enough to halt the price from going higher. For Ice Coin, **$0.00600** is the immediate resistance level. If the price breaks and holds above this point, it could indicate continued bullish momentum (price moving up).
- **Next Resistance Levels**:
- **$0.0069534** 🚀
- **$0.00700** 🚀
These are the next levels where price could face resistance after breaking the $0.00600 mark. If the price successfully reaches and holds these levels, it indicates strong upward momentum. Traders will likely be watching these points to see if Ice Coin can break through and continue growing.
---
- **Support**: $0.05643 ⚖️ & $0.05500 ⚖️
Support levels are price points where buying pressure is expected to be strong enough to prevent the price from falling lower. If Ice Coin doesn't manage to break through the $0.00600 resistance, it could fall back to these support levels. If the price holds at these points, it may bounce back upward.
- **Next Support Levels**:
- **$0.00500** ⚖️
- **$0.00400** ⚖️
These are critical support levels where the price could find a strong buying interest if it falls below $0.05643. If the price drops below these support levels, it may indicate a bearish trend, and the price could continue to fall.
---
### **What This Means for Traders**
- **Increased Volume**: If trading volume increases, it could signal that more people are interested in buying or selling Ice Coin, which could push the price either upward (bullish) or downward (bearish), depending on how the buying and selling balance out. The volume is a key indicator to watch.
- **Breaking Resistance**: If the price breaks the $0.00600 resistance and holds above it, this would be seen as a bullish signal, meaning the price could keep rising. The next target would be $0.0069534 or $0.00700.
- **Falling Below Support**: If the price can’t hold the support levels at $0.05643 or $0.05500, the next downside targets are at $0.00500 and $0.00400. This would be seen as a bearish trend, and traders would be cautious about the price dropping sharply.
---
**⚠️ Important Note**:
This is **not financial advice**. Cryptocurrency is highly volatile, and prices can change quickly. Always do your own research (DYOR) and consider consulting with a financial advisor before making any trading decisions. 🚫
---

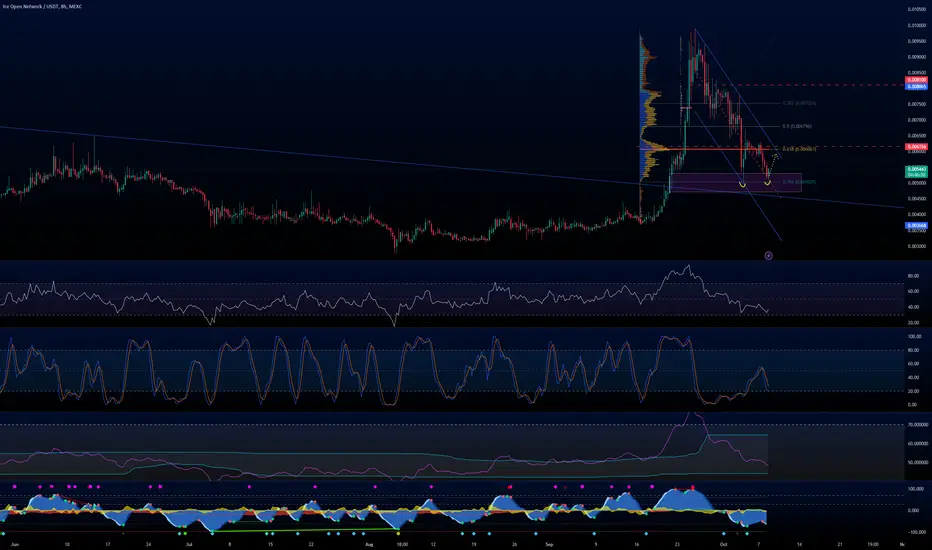
ICE bullish scenarioICE recently planted a HL, and has confluence with 786 fib retrace level.
Also looks to have come back and tested the breakout from the previous descending wedge/trend.
Potential to enter long on a reaction to this price level with invalidation below the previous low.
ICE | Inverse H&SThe chart shows a potential inverse head and shoulders pattern, which is a bullish reversal signal. The price is testing the neckline, and a successful breakout could lead to a significant move upwards toward the resistance zone around 0.005500 USDT. This pattern suggests that the market may be reversing its downtrend, with the highlighted resistance acting as a key level to watch. A breakout with increased volume would confirm the bullish trend, but failure to breach the neckline could result in consolidation or a pullback.
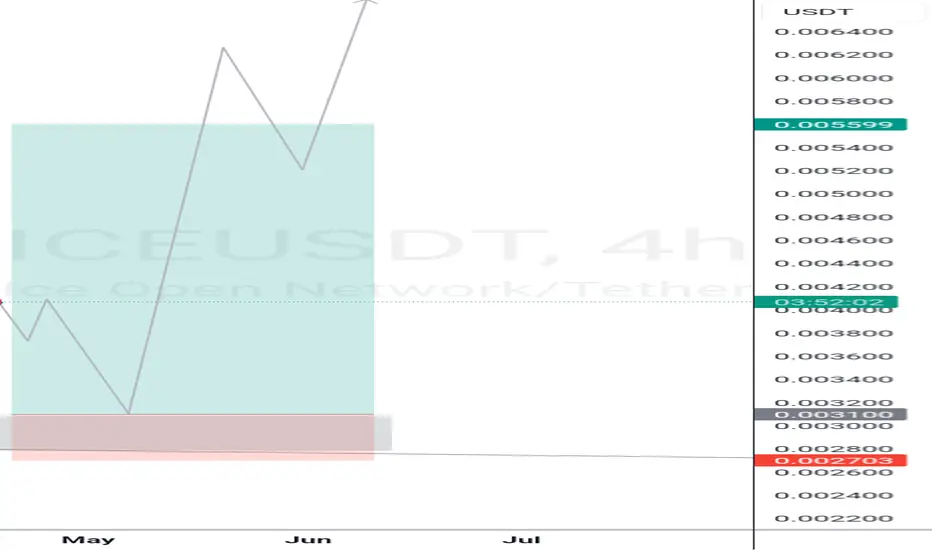
Ice predicts in a week's comeIn the past few days, after being listed on 22 exchanges, NYSE:ICE has been moving towards the 0.006 support zone after exiting the congestive triangle. Don't forget that Mainnet is ahead, and Binance and Baybit remain.

ICE Trading IdeaICE can give a supper bullish after correction or go bear after it goes below this region


ICE ICE Baby 0.005 this is so gooda layer 1 on ethereum and binance chain yet not yet listed on major CEX
maybe this is is a sign that tells us to get on it while its quiet

ICE/USDT: Primed for a Bullish Breakout.In the world of cryptocurrency trading, ICE/USDT is demonstrating a compelling technical setup that suggests a strong bullish momentum. Here’s an in-depth analysis of the current market dynamics, technical indicators, and strategic trading opportunities.
The Ice Open Network (ION) has been making headlines with its innovative approach to blockchain technology. Recently, ICE/USDT has gained traction due to the successful launch of the ION tap-to-mine app, which attracted millions of users shortly after its release. This has significantly boosted market confidence and contributed to ICE’s strong performance on global exchanges
Market Overview
Current Price: $0.005272 (+9.40%)
Volume: 495.33M
Average Volume (30D): 710.25M
Technical Indicators Analysis
1. Stochastic RSI (3, 3, 14, 14):
• Current Value: 78.81 (Overbought)
• Signal: The Stochastic RSI is in the overbought territory, indicating strong upward momentum. A potential pullback might occur before the continuation of the upward trend.
2. Relative Strength Index (RSI) (14):
• Current Value: 64.36
• Signal: RSI is approaching the overbought threshold of 70, suggesting bullish strength with room for more upside before becoming overextended.
3. Commodity Channel Index (CCI) (20):
• Current Value: 273.21
• Signal: The CCI is well above the +100 level, indicating a strong bullish trend. The high CCI value suggests the price is well above the moving average and may continue its upward trajectory.
4. Moving Averages:
• 10 EMA: 0.004844 (Buy)
• 20 EMA: 0.004795 (Buy)
• 50 EMA: 0.004647 (Buy)
• 200 SMA: N/A
• Signal: The alignment of shorter-term EMAs above the longer-term EMA confirms a bullish market. The consistent ‘Buy’ signals across various moving averages reinforce the bullish outlook.
5. Ichimoku Cloud:
• Conversion Line: 0.004930
• Base Line: 0.004938
• Cloud Span: Bullish
• Signal: The price action above the Ichimoku Cloud indicates a bullish trend. The recent breakout above the cloud is a strong buy signal.
Price Action and Patterns
The price action reveals a bullish candlestick pattern with a significant increase in volume, confirming the upward movement. The recent breakout above the resistance level of $0.005363 is noteworthy, suggesting the potential for further upside.
Long Position Strategy:
• Entry Point: $0.005290
• Target Price: $0.006092 (Resistance Level R2), with potential extension to $0.007391 (Resistance Level R3)
• Stop Loss: $0.004793 (Pivot Point P)
• Rationale: Entering at the current price or on a slight pullback, with targets based on historical resistance levels, provides a favorable risk-reward ratio. The strong buy signals from multiple technical indicators support this strategy.
Short Position Strategy:
• Entry Point: $0.006092 (R2 Level)
• Target Price: $0.005382 (R1 Level)
• Stop Loss: $0.006500
• Rationale: If the price reaches the R2 resistance level, a short position could be considered, anticipating a potential pullback. Setting a tight stop loss just above the resistance level minimizes risk.
Conclusion
ICE/USDT is exhibiting robust bullish momentum, supported by multiple technical indicators and price action patterns. Traders should look for long opportunities on minor pullbacks or breakouts, with specific entry, target, and stop-loss levels in mind. Short opportunities may arise if the price approaches significant resistance levels, providing tactical entry points for short-term trades.
With the current strong buy signals, ICE/USDT appears poised for a significant move upwards. Keep an eye on the key levels mentioned, and stay agile in your trading strategy to capitalize on this potential breakout.

ICEUSDT BULLICEUSDT will buy drastically. It is a very good opportunity to buy now because Ice mainnet will be launched on October, 2024.
Buying now will position you at a very high return.
Final Ice distribution will commence before the open mainnet. Don't take this opportunity for child's play. Hurry and Buy Now! 😊

$ICE- SUCH A WILD CARDFirst of all ..i don't like when a project owners looks shady in their dealings..Its a red flag for me!
The Blue print say one thing while their actions says another.
Been struggling with accepting the idea behind this project because i started mining for a while ..earn some tokens but its bull season..so you gotta make money right?
So this has bleed the airdrop wave and is making a new ascent..with their upcoming Ice network mainnet activity coming up,it wont be bad to hold some little bag & ride the wave...Just gauge your risk/reward ration before jumping on it ... I didn't invest a dime but i got some airdrop token still in my wallet waiting to see how it goes.
Seriously NFA because i still do not trust te project creators.
Already trading on OKX,Kucoin,Gateio,Coinex etc..

ICE...is it bottomed ?
hey traders,
looking at the current waves structure maybe the price dip reach an end and ready for a major reversal and the good thing here is that the invalidation level is so close to consider.
price crossing up 0.0045 level might spark a reversal.
Not FA
good luck
