A50 - China Contracting - Personal Consumption DecliningAs Kuh Kuh Cathy Woods finds God and re-discovers "Faith" in investing -
her flock discovers the very same religious experience.
Faith in Central Banks ability to backstop Markets is accelerating.
The phenomena is not limited to TECH, it is global and it has expanded
to every Capital Stock - Real Estate, Equities, Commodities and Bonds.
Crypto and the Metals Complex are the laggards.
This brand of unprecedented Mania has begun its Zenith Phase.
It is well beyond the irrational Mania of the DotCom Mania, well
beyond.
Buy buy, buy... Sellers and Intelligent observers are mocked for
their plaintiff wails of objection.
Clearly there is an immense danger to this, one which will eventually
present itself in the near future, until then the BBB Herd will expend
all the Capital Energy they can and then move to Leverage via
increased Margin.
Margin as a percentage of Capital Stock for Equity is frankly minimal
so there remains intense upside pressure for those who begin to
cheer their own successes believing higher prices are expected.
Caution for Sellers here as this can become far more distended.
We will see how the updated Levels for NQ ES YM trade, Friday
all Futures Indices hit their Extension Targets.
Earnings is dead ahead and INTC gave a clear warning, it was not
heeded as "Faith" itself and its followers pressed their luck.
We anticipate this to continue after the July 21st reversal
period was immediately snapped up 2X.
Dangerous times, Good Luck and Trade Safe.
CHINA50 trade ideas

China 50 - great convergenceHi!
Here an interesting idea about this important index.
There are three main big supports crossing in this whole area.
I am opening new entries.
Any comments? please let me know.
Good luck!!!!


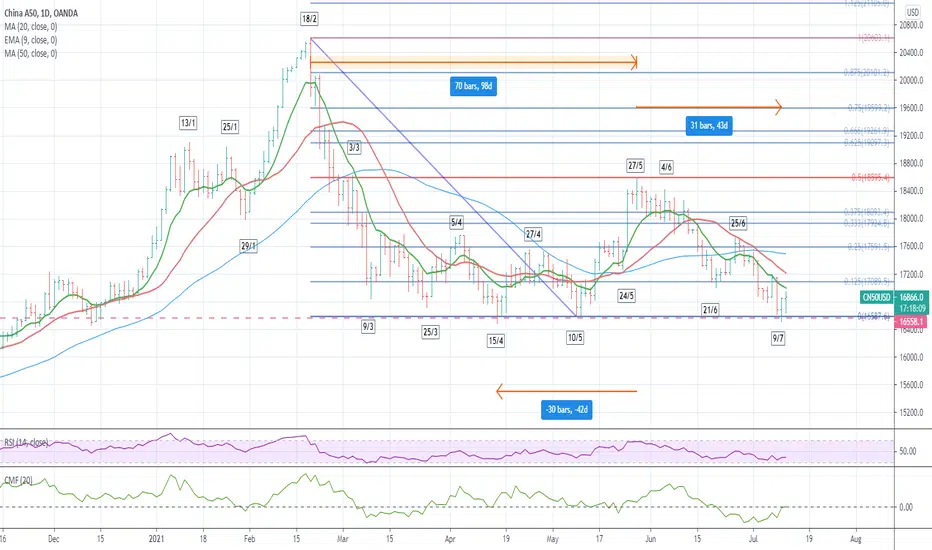
CN50 - calling bottom hereJuly 9 - CN50 seems has reached the same price level the 3rd time for the past 3 months (strong support level). This 16550 level is also resistance level back in early July 2020.
CN50 reached high in Feb 18 and has since shown weakness whereas the US indices are the opposite. It retraced 50% on May 27 (42 days from Apr 15) and down for 43days until Jul 9.
It may be too early to call this a bottom ... time will tell as anything can happen.
But i do have a buy order in place at 16955 and Stop loss 16480.
China 50 - Perfect PitchanHi friends!
Here an interesting idea! Price is moving at 300 daily EMA support, and it has reach the bottom of a big pitchan triangel.
In my particular opinion it is a good chance to open long positions, so I am opening new entries.
Any comments?
Thank you!
Israel

EMA Slope+EMA Cross Strategy (by ChartArt) - INDICES BacktestingThis is the 3rd idea regarding the same strategy
Check my 1st (FOREX), 2nd(CRYPTOs) and 3rd(INDICES/METALS)-this one
I will split each strategy backtesting in this manner
I'm talking for strategy
EMA Slope + EMA Cross Strategy (by ChartArt) Mar 10, 2018
I test 29 Forex pairs from FXCM, 51 Crypto Pairs from Binance and 46 CFDs Indices and Metals from OANDA
In total 126 pairs using 32 !!! timeframes
1,2,3,4,5,6,7,8,10,12,15,17,20,24,25,30,45 minutes
1,1-1/2,2,3,4,5,6,7,8,10,12,16,20 hours
1 and 2 Days
In total 4032 results per strategy
I like profit factor and Sharpe ratio as my main guides but also percent profitable does matter
The results of forex were with 1000 contracts, default currency USD and 0.07 USD per order commission
At Cryptos i use 1 contract, default currency USD and no commission because most cryptos are spread based.
At Indices i use the same details as Crypto.
I didn't touch any settings at the strategy for all three ideas
The pair and the time frame you see is the winner in the INDICES/METALS category with profit factor criteria
I can't post direct links according to house rules, since i love TradingView and i play with their rules but if you search a bit you will find more info

China 50 - Importan SupportHi friend!
Here an important support.
Mi idea is to open new positions.
China -the factory of the world- can´t go lower mainly because of reopening economies.
Obviously I recommend to open positions using small-lots strategy.
Good Luck!

CN 50: Time to buy now at Strong Support.CN 50: Time to buy now at Strong Support.
Buy Now: 16686
SL: 16460
TP1: 18400
TP2: 20125


Expecting Pullback towards 12,800Over the weekend, China PBOC announced
"More Powerful"policies to help spur growth in China. However, despite the positive news, China A50 turned lower.
Currently, the index is trading at a key resistance level. Confluence of Downtrend line resistance and HVN area.
Thus, we expect price to retest 12,800 which is also Fibo 38.2% level.
13,700 will remains as our pivot. If index breaks above this key level, we will see the index retesting it previous high at 14,700

Analysis of the Chinese CN50 index.I spent a lot of time searching for information regarding the sudden drops and increases in the CN50 index price.
From the information obtained on many pages, I analyzed and described everything in the graph.
I checked every page I visited to avoid taking into account the fake news that was being disseminated. I wonder if it really happened.
Enjoy reading.


China 50 Potential Bullish FlagAs S&P500 and global indices near an all-time high, the Chinese indexes are lagging. Nonetheless, price has managed to recover from its low in May. Now price is pulling back to test the 17750 level. The current pullback resembles a bullish flag.

BUYCHINA50 broke out of the consolidation phase and retested the 0.382 fib level. Expecting upside from here.


CN50USD Set up for bullish continuationGreetings Folks,
China A50 Index a Bull flag pattern has been forming on 4HR chart.
A bullish break is a key confirmation of the uptrend continuation. It also confirms the end of wave 4 and the start of wave 5.
Watch out for a possible breakup level.
All the details on the chart...
Good Luck.!!

Just an analysis - China A50China index has stalled and gone backwards since mid Feb 2021, when the US indices are making all time highs until mid May.
Doing a time count analysis, CN50 has gone down 56 calendar days and 42 up (42 is 3/4 of 56).
It could potentially be doing a ABC correction and with C and end up at 14434 which is the 2019 top.

CN50USD high risk trade with nice profitThis is a high risk trade (spikes) but could give a good profit in a short time ..Tight Stop loss .. SELL STOP at 18230 so there is where the trade starts !! Good luck..

A great opportunity to buy China A50China's economy will keep rising up, and the real estate market has cooled down ,money will keep flowing into China's stock market. There will be a long bull market. So, there will be a great opportunity to buy China A50 Index.
