DAX has outperformed America and will continue to 24,000!The DAX, Germany's main stock index, has been on a rampage!
Compared to American indices and crypto, it's continued to hit record highs.
Several factors have been fueling this rise:
Increased Government Spending: Germany's plan to invest around €500 billion in infrastructure and defense has boosted investor confidence.
European Central Bank (ECB) Rate Cuts: The ECB's recent interest rate reductions aim to stimulate economic growth, making equities more attractive.
Attractive Valuations: European stocks, including those in the DAX, have lower price-to-earnings ratios compared to U.S. stocks, drawing investors seeking value.
investopedia.com
Global Economic Optimism: Positive developments, such as potential resolutions in trade tensions and geopolitical conflicts, have improved the global economic outlook, benefiting export-oriented indices like the DAX.
Technically, it's been a trend traders haven. It continues to bounce up on not only the Uptrend line but also the 20MA.
So if momentum like this continues we will see it reach a psychological level of 24,000.
Disclosure: I am part of Trade Nation's Influencer program and receive a monthly fee for using their TradingView charts in my analysis.
DE30 trade ideas

GER30 SELLThe level has a 50% chance of falling.
Reversal up to 50%, depending on resistance levels and divergence

DAX - rising wedge 15 minutes DAX Index – 1H Chart Analysis (February 20, 2025)
1. Market Structure & Trend Analysis
Ascending Channel: The price has been trending upwards within a well-defined ascending channel.
Support Retest: Price is currently testing the lower boundary of the channel, which has acted as dynamic support throughout the uptrend.
Potential Bounce: The blue arrow suggests an expected continuation to the upside if the support holds.
2. RSI & Momentum Analysis
RSI at 42.14: Indicates the market is approaching oversold conditions on the 1H timeframe, meaning a possible bounce is near.
Bullish Divergence? Not confirmed yet, but if RSI starts rising while price remains stable, it could indicate a reversal.
3. Key Levels to Watch
Support:
22,400 - 22,500 (Lower trendline of the channel)
22,250 (Stronger support if breakdown occurs)
Resistance:
22,750 - 23,000 (Upper trendline and psychological level)
4. Potential Trade Scenarios
📈 Bullish Scenario (Higher Probability)
If price holds above 22,500, we could see a continuation towards 22,750 - 23,000.
Long Setup:
Entry: 22,500 - 22,550 (confirmation of support hold)
Stop-loss: Below 22,400
Target: 22,750 - 23,000
📉 Bearish Scenario (Lower Probability)
If price breaks below 22,400, a decline toward 22,250 or lower could follow.
Short Setup:
Entry: Below 22,400
Stop-loss: Above 22,550
Target: 22,250 - 22,000
5. Conclusion & Strategy
Bias: Bullish as long as price stays within the ascending channel.
Trade Idea: A long trade from 22,500 with a stop below 22,400 offers a good risk-to-reward ratio.
Risk Management: If price starts consolidating near the lower boundary without bouncing, consider reducing risk or waiting for further confirmation.

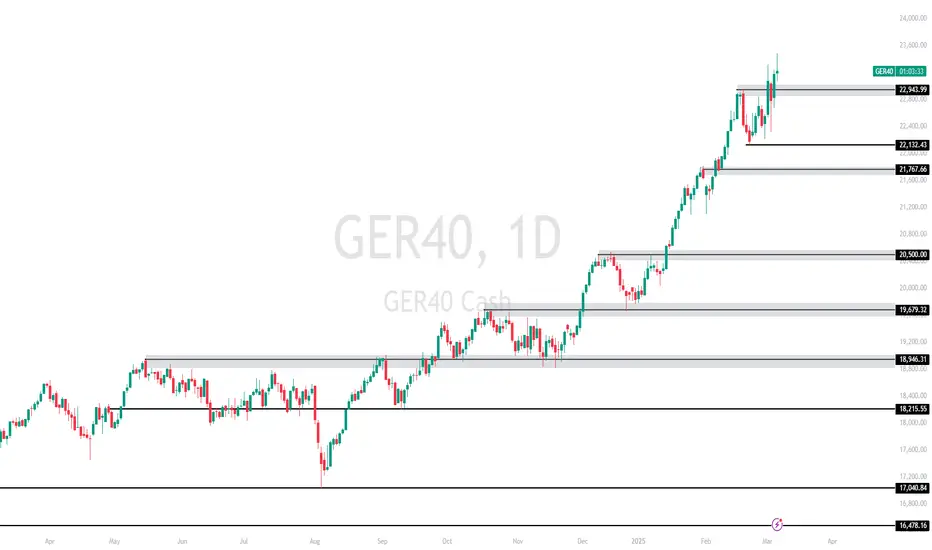
GER40 (DAX) Analysis & Trade Ideas📊 Market Structure & Analysis
GER40 is in a strong bullish trend, forming higher highs & higher lows.
Resistance: 22,943 – Price is testing this level; a breakout could push higher.
Support Levels: 22,132, 21,767, and 20,500 – Potential pullback zones.
Break & Retest Pattern: Price has been breaking resistance and turning it into support, confirming an uptrend.
🔹 Bullish Scenario
✅ Buy on pullback at 22,132 - 21,767 if price respects support.
🎯 Target: 23,000+
🛑 Stop: Below 21,500
✅ Breakout Buy if price breaks & retests 22,943.
🎯 Target: 23,500+
🛑 Stop: Below 22,700
🔻 Bearish Scenario
❌ Sell rejection at 22,943 if price fails to break higher.
🎯 Target: 22,132, then 21,767
🛑 Stop: Above 23,000
⚡ Final Thoughts
Market structure remains bullish—focus on buying dips & breakouts. Shorts only if rejection is strong. 📈🔥
#GER40 #DAX #Forex #Trading
DAX hits fresh record on stimulus plansThe German DAX index has just hit a fresh all-time high.
The latest gains come as a global bond sell-off extended its run, driven by Germany’s ambitious spending plans, which are poised to reshape the eurozone’s economic outlook and has already had a sizeable impact on regional stocks. Today, the focus was also on the rate decision from the European Central Bank. The ECB cut rates by 25bps as expected and President Lagarde said the next rate decision in April is defendant on data.
The market's attention shifts to US labour market data as we head to the business end of the week.
From a technical view point, the strong rally means dip-buyers continue to remain in control of price action. For that reason, there is no point in trying to pick the top. Concentrate on support levels until we see a clear reversal pattern.
Short-term support now comes in around 23,311, marking the high from Monday, followed by 23,229, marking the high from Wednesday. Below these levels, 22,937 is the next key support to watch for a potential bounce, before the trend line comes into focus a bit lower down.
By Fawad Razaqzada, market analyst with FOREX.com

Final update d30How are you friends
I posted in my profile from dates from the beginning of January
And this is the same drawing
The trend was up and the target was the end of 22600 and the end of the blue line is 22750 as the final point of the blue line and now it seems we still have an uptrend as I told you I will update
But there is no doubt that the trend will head to much higher areas at least 23k
I will update again

DAX 40 Index Technical AnalysisDAX 40 Index Technical Analysis
Market Profile Insights
Value Area Analysis
Trading ABOVE yesterday's value area high
Seeking extension from Monday's Point of Control (POC)
Anticipating potential reaction zones at Monday's High Volume Nodes (HVNs)
Current price positioning suggests bullish market sentiment
Trade Parameters
Entry Point: 22,833.71
Target Price: 23,356.52
Stop Loss: 22,572.31
Risk-Reward Ratio: 1:2
Technical Narrative
Price breaking through previous resistance levels
Showing strength by trading above key market profile structures
Volume profile indicates institutional accumulation
Momentum suggesting potential trend continuation
Entry Confirmation Criteria
Multiple timeframe alignment
Strong volume profile
Market profile structural support
Momentum indicator confirmation
Risk Management Considerations
Monitor reactions at previous HVNs
Use market profile levels for dynamic stop management
Be prepared for potential consolidation zones
Conclusion
High-probability bullish setup with robust market profile confirmation. Disciplined, structure-based approach recommended.

Germany30 Short Setup: High-Confidence Trade with Massive PointsHello Guys recently we have seen a massive downward shift in the dax 30 . a quick solid setup with entry stoploss and targets outlined in the chart
Risk less: we are in a NFP week where markets turns wild and choppy but this is a high probability trade setup
Good luck

GER30 POSSIBLE SELL?The market is currently testing the current Weekly area.
Based on Daily, the market seems to be forming a possible reversal pattern which could lead to a possible reversal.
We could see SELLERS coming in strong should the current level hold.
Disclaimer:
Please be advised that the information presented on TradingView is solely intended for educational and informational purposes only.The analysis provided is based on my own view of the market. Please be reminded that you are solely responsible for the trading decisions on your account.
High-Risk Warning
Trading in foreign exchange on margin entails high risk and is not suitable for all investors. Past performance does not guarantee future results. In this case, the high degree of leverage can act both against you and in your favor

DAX 🗝️ LEVELS TO WATCH 👀AND WHY 🤔Hello awesome traders, let's have a look at the DAX. I have a new analysis today as the previous exchange seems to be shut down.
Here are the details: The DAX on a weekly chart is trading a cup and handle pattern, and the price is now trading below near the target zone 1 at 62%: 19078.70. After a successful breakout from 16305.21, the target zones are as follows:
Target Zone 1:
62%: 19078.70
78%: 19817.23
Pattern Height:
100%: 20784.96

DAX H1 | Potential bullish bounceThe DAX (GER30) is falling towards a pullback support and could potentially bounce off this level to climb higher.
Buy entry is at 23,236.99 which is a pullback support
Stop loss is at 23,075.00 which is a level that lies underneath an overlap support and the 23.6% Fibonacci retracement level.
Take profit is at 23,593.28 which is a resistance level that aligns with the 127.2% Fibonacci extension.
High Risk Investment Warning
Trading Forex/CFDs on margin carries a high level of risk and may not be suitable for all investors. Leverage can work against you.
Stratos Markets Limited (www.fxcm.com):
CFDs are complex instruments and come with a high risk of losing money rapidly due to leverage. 63% of retail investor accounts lose money when trading CFDs with this provider. You should consider whether you understand how CFDs work and whether you can afford to take the high risk of losing your money.
Stratos Europe Ltd (www.fxcm.com):
CFDs are complex instruments and come with a high risk of losing money rapidly due to leverage. 63% of retail investor accounts lose money when trading CFDs with this provider. You should consider whether you understand how CFDs work and whether you can afford to take the high risk of losing your money.
Stratos Trading Pty. Limited (www.fxcm.com):
Trading FX/CFDs carries significant risks. FXCM AU (AFSL 309763), please read the Financial Services Guide, Product Disclosure Statement, Target Market Determination and Terms of Business at www.fxcm.com
Stratos Global LLC (www.fxcm.com):
Losses can exceed deposits.
Please be advised that the information presented on TradingView is provided to FXCM (‘Company’, ‘we’) by a third-party provider (‘TFA Global Pte Ltd’). Please be reminded that you are solely responsible for the trading decisions on your account. There is a very high degree of risk involved in trading. Any information and/or content is intended entirely for research, educational and informational purposes only and does not constitute investment or consultation advice or investment strategy. The information is not tailored to the investment needs of any specific person and therefore does not involve a consideration of any of the investment objectives, financial situation or needs of any viewer that may receive it. Kindly also note that past performance is not a reliable indicator of future results. Actual results may differ materially from those anticipated in forward-looking or past performance statements. We assume no liability as to the accuracy or completeness of any of the information and/or content provided herein and the Company cannot be held responsible for any omission, mistake nor for any loss or damage including without limitation to any loss of profit which may arise from reliance on any information supplied by TFA Global Pte Ltd.
The speaker(s) is neither an employee, agent nor representative of FXCM and is therefore acting independently. The opinions given are their own, constitute general market commentary, and do not constitute the opinion or advice of FXCM or any form of personal or investment advice. FXCM neither endorses nor guarantees offerings of third-party speakers, nor is FXCM responsible for the content, veracity or opinions of third-party speakers, presenters or participants.

MY THOUGHTS ON GER40 CASH INDEX
From the chart i see a brief accumulation which tended towards the upside to liquidate those in short positions (stop hunt) as a form of manipulation.
If it doesn't break through that supply zone there will be a retest to fill-up the FVG below (on the 1H TF) and probably takeout those in long positions before breaking through the supply to give us a new ATH.
If it does break through the demand below we'll most likely see a dump towards the long awaited FVG around 20k region (from the Monthly TF).
So, lets see how this plays out.

Ger40 Order Flow: Liquidity withdrawal before trend continuation📌 Idea:
We have confirmed a bullish structure and expect liquidity to be taken from below. The price is likely to move towards the 15M TF FVG with a sweep of the lows.
📍 Two possible entry setups:
1️⃣ After the liquidity sweep and confirmation of a bullish setup.
2️⃣ Breakout from the range and a retest – this zone will provide an entry point.
📈 Entry: after confirmation on a lower TF.
🎯 Targets: marked on the chart.
🛑 Stop loss: below the last low.

DAX Support Ahead! Buy!
Hello,Traders!
DAX is fall down now
But will soon hit a horizontal
Support of 22,250 so after
The retest a local bullish
Rebound is to be expected
Buy!
Comment and subscribe to help us grow!
Check out other forecasts below too!

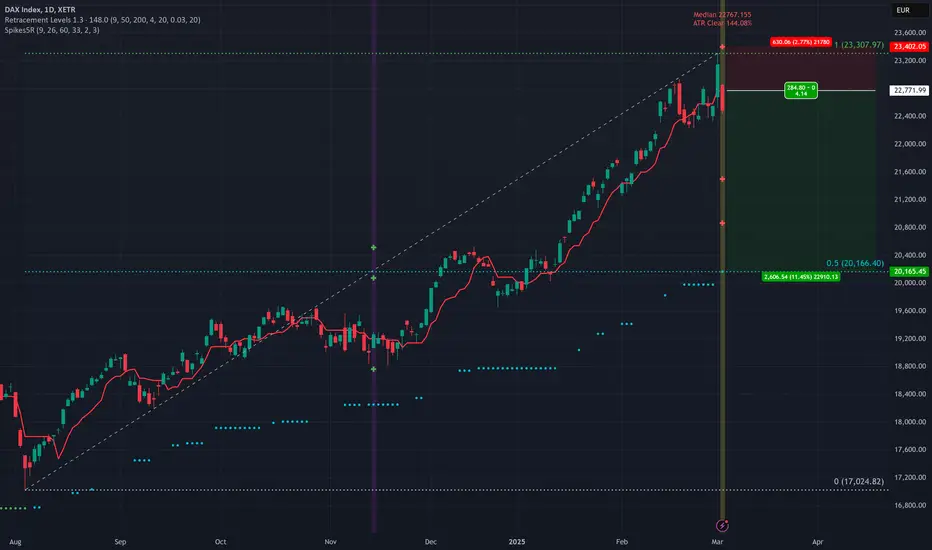
Falscher Ausbruch auf DAXThe German Stock Index XETR:DAX made a new All Time High yesterday only to close back inside the high's recent price action. This sets up a clear Spike with today's close back inside.
Many signs in the US stock market are pointing to the market turning over for at least a bearish correction. I'll be watching the XETR:DAX for a bearish play of this Spike: possibly back down to the 50% of the rally since August 2024.
DAX Bullish breakout retest? The DAX (DE40) Index maintains a bullish sentiment, supported by a longer-term uptrend. Recent price action has confirmed a breakout above a key level, but the possibility of a retracement remains, making it crucial to assess both bullish and bearish scenarios.
Key Levels to Watch
Resistance Levels: 22900, 23145, 23460
Support Levels: 22230, 21900, 21780
Bullish Scenario
If DAX sustains price action above the 22230 breakout level, it could signal strong bullish momentum. A successful retest of this level as support may provide a foundation for further upside, with key resistance targets at 22900, followed by 23145 and ultimately 23460 in the longer term.
Bearish Scenario
A failure to hold above 22230, followed by a confirmed breakdown and daily close below this level, would weaken the bullish outlook. In this scenario, selling pressure could intensify, leading to downside targets at 21900, with further retracement potential toward 21780 and 21607 over an extended timeframe.
Conclusion
DAX remains in a bullish structure, but price action around the 22230 level will be critical in determining the next move. A strong hold above this level could reinforce further gains, while a breakdown below it may trigger deeper retracements. Traders should monitor key support and resistance levels closely for confirmation of the next directional move.
This communication is for informational purposes only and should not be viewed as any form of recommendation as to a particular course of action or as investment advice. It is not intended as an offer or solicitation for the purchase or sale of any financial instrument or as an official confirmation of any transaction. Opinions, estimates and assumptions expressed herein are made as of the date of this communication and are subject to change without notice. This communication has been prepared based upon information, including market prices, data and other information, believed to be reliable; however, Trade Nation does not warrant its completeness or accuracy. All market prices and market data contained in or attached to this communication are indicative and subject to change without notice.

Took a sell on Ger40Is this going to drop or pull another trick? I've decided to sell on Ger40. Let's see, like, and comment.

GER40 – Long After Liquidity Grab in Uptrend📌 Idea: We are in an uptrend on H1. The price has grabbed liquidity from below, which may serve as fuel for further upside movement. Waiting for confirmation on lower timeframes.
📊 Entry conditions:
Liquidity grab from the downside
Confirmation on lower TFs (M15/M5)
Take Profit 1: First local high
Take Profit 2: Key resistance level
🎯 Target: Continuation of the uptrend after liquidity sweep
⚠️ This is not financial advice. Always consider risk management!

DAX Rally Overstretched? Initiating a Strategic Short PositionSince February 25, the DAX has surged by 7.24% without a meaningful pullback, suggesting potential overextension. Coupled with emerging bearish technical indicators and unfavorable economic fundamentals, this presents an opportunity for a short position.
Fundamental Analysis:
Germany’s economic landscape is currently facing several challenges:
• Economic Slowdown: The government has slashed its 2025 growth forecast to 0.3%, down from the previous 1.1%, citing trade tensions and domestic uncertainties.
• Industrial Strife: Major companies are implementing job cuts and factory closures to manage rising costs and global competition, leading to increased labor disputes and uncertainty over Germany’s manufacturing sector.
• Political Uncertainty: Upcoming European and local elections have intensified debates over economic policies and migration, contributing to market volatility and investor caution.
Trade Details:
• Entry: 22,611
• Stop-Loss: 23,000
• Target Zone: 21,800 - 21,600
• Partial Profits: To be taken at key support levels
The confluence of technical signals and economic headwinds suggests a potential correction in the DAX. This short trade aims to capitalize on the anticipated pullback, with risk managed through a well-placed stop-loss and planned profit-taking at identified support zones.
Next week will be critical for the Eurozone, with key economic data releases shaping market sentiment. Investors should particularly watch the PMI data on Friday, which could significantly impact expectations for the region’s economic trajectory.
Stay informed and trade responsibly.
Note: Please remember to adjust this trade idea according to your individual trading conditions, including position size, broker-specific price variations, and any relevant external factors. Every trader’s situation is unique, so it’s crucial to tailor your approach to your own risk tolerance and market environment.

DAX 40 Hits New Record HighThe trading week kicks off with strong optimism in major global indices, with the DAX 40 in Frankfurt reaching a new record, rising over 3% and surpassing the 22,300-point mark. This outstanding performance is backed by investment fund prospects focused on defense and infrastructure projects, for which a plan worth nearly one trillion euros is under discussion. Some German companies linked to these sectors have even achieved double-digit gains, supporting the German index.
On the geopolitical front, UK Prime Minister Keir Starmer has announced the development of a peace plan for Ukraine, following a tense meeting between former U.S. President Donald Trump and Ukrainian President Volodymyr Zelensky. The goal of European powers is to maintain market stability and confidence, despite uncertainty stemming from negotiations with Washington and potential trade frictions. However, the threat of new U.S. tariffs remains one of the primary risk factors for the region.
On the macroeconomic side, the eurozone inflation data —which stood at 2.4% annually in February, slightly above the 2.3% forecast— continues to support expectations of an interest rate cut by the European Central Bank this week. While energy and services showed some moderation in their increases, the rise in unprocessed food (3.1%) and non-energy industrial goods (0.6%) suggests that price dynamics still require monitoring. In this context, core inflation fell to 2.6%, remaining above expectations but marking its lowest level since January 2022.
In terms of immediate impact, the strength of the defense sector and infrastructure investments could sustain the bullish momentum in European equities. This scenario highlights the importance of coordination between European leaders and negotiations with the U.S., which will be crucial to supporting economic momentum and avoiding trade tensions.
With this positive market environment at the start of the week, there are promising opportunities for European markets, as long as the key players strike a balance between defense spending ambitions, the geopolitical implications of the Ukraine peace plan, and the risks associated with U.S. trade policy.
Pepperstone doesn’t represent that the material provided here is accurate, current or complete, and therefore shouldn’t be relied upon as such. The information, whether from a third party or not, isn’t to be considered as a recommendation; or an offer to buy or sell; or the solicitation of an offer to buy or sell any security, financial product or instrument; or to participate in any particular trading strategy. It does not take into account readers’ financial situation or investment objectives. We advise any readers of this content to seek their own advice. Without the approval of Pepperstone, reproduction or redistribution of this information isn’t permitted.


Weekly Technical AnalysisStart your week by identifying the key price levels and trends.
The SpreadEx Research team has analysed the most popular markets, including stocks, indices, commodities & forex.
--------------------------------------------------------------------------------------------------------------
Analysis
Germany 40 remains in a bullish, impulsive phase, with its price at 22,687, having remained above the 20-day VWAP of 22,429 throughout the last pullback. The RSI reading of 64 signals solid momentum but stays below overbought levels. Support is identified at 21,877, while resistance is at 22,982.
UK 100 continues its bullish trend with an impulsive price move to a new record high, currently trading at 8,844, surpassing the 20-day VWAP of 8,729. Momentum remains bullish but stable with an RSI of 65. The nearest support sits at 8,591, while resistance at 8,867 is currently being tested.
Wall Street's price action suggests a neutral stance, consolidating at 43,860, slightly below the 20-day VWAP of 43,900. The RSI of 48 confirms a lack of directional conviction. Support rests at 42,955, while resistance near 44,940 defines the upper boundary of the current range.
Brent Crude remains in a neutral, consolidative phase overall, trading at 7,281, slightly under the 20-day VWAP of 7,445. An RSI of 40 suggests soft momentum, keeping the market in check. Key support is observed at 7,193, whereas a break above 7,696 could reignite bullish sentiment.
Gold's bullish trend has shifted into a corrective phase, with its price at 2,862, now trading below the 20-day VWAP of 2,903. With RSI at 48, momentum has softened, suggesting a period of consolidation. Support is found at 2,843, while resistance at 2,964 presents the next upside barrier.
EUR/USD remains in neutral consolidation, trading at 1.0402, just below its 20-day VWAP of 1.0432. The RSI of 47 highlights indecisiveness, keeping the pair within a tight range. Support lies at 1.0306, while resistance at 1.0557 must be cleared for a directional move.
GBP/USD continues its bullish, impulsive ascent, currently positioned at 1.2602, just above the 20-day VWAP of 1.2571. The RSI at 54 signals stable momentum. Key support is located at 1.2388, while resistance at 1.2753 defines the next upside level.
USD/JPY remains in a bearish, impulsive phase, trading at 150.21, below its 20-day VWAP of 151.08. The RSI at 41 suggests selling pressure remains dominant. Immediate support is placed at 148.10, with resistance at 154.05 acting as a potential reversal point.

Most overbought in 10 years !? I've used 3 forms of technical analysis to make a case for a major top forming in the European markets. If this turns around, it could lead to a 10% selloff very quickly and if this transforms into a bear market then 20% drop is totally on the cards. Nothing goes up forever.
