France's CAC40 This has been fun going through the different markets because I see hybrids between various price actions. This market is a little difficult to settle on. I like this bear flag on the local scale. The last couple of days almost makes it look like it wants to go up again to retest that upper channel, but considering how bearish the other markets look, I doubt that will happen. And I have circled a similar "scoop" from a few weeks ago that promptly reversed and went lower.
The intermediate chart looks much like the Dow, and Dax. Look for that broadening pattern to be retested and to ultimately fail.
Long-term chart is weird. Just imagine having gone nowhere in price for thirty years. Oy. That's something we're just not accustomed to here in the States. That said, this huge triangle could go either way. It will almost certainly retest the lower orange channel.
F40 trade ideas

CAC40 (France) - choppy to bearish - what’s next? CAC40 (FCHI - France) has completed B wave in complex correction as wxy within ABC zigzag down cycle in 1 hr time frame. The C wave down has just begun, but wait for 2nd wave pull back to get in to trade with invalidation level of 5074. The target zone will be 4550 level. In weekly time frame It has completed (A)(B)(C) flat wave from high made in 2018. The high made in 2020 was irregular (B) wave. It is moving within corrective cycles, which is little hard to predict with ease.

France 40 SELL SOON market going under fear for uncertainty and all market downside.
If you found this analysis useful, please like it and share it with others so they can benefit from it too.


Long term view on CACCluster of resistances and these resistances are strongs ! Time to short on daily time frame...


IT40 Index (FTSE MIB) - You know where it goes up or down ? IT40 Index (FTSE MIB - Italy) has completed B wave within ABC zigzag down cycle, which is zigzag with smaller c subwave, which resulted in sharp drop. It is within C wave down, where 3rd subwave of C is in progress. Price must stay below 19548 level to validate the count. In weekly time frame, it is choppy after ABC correction ends at last low and new cycle WXY correcting now, where X wave down is under progress. IT40 is weaker index within European market as well as global indices.


France CAC 40 Short Update Added additional short shares borrowed to $CAC40 after today's PMI number's it's clear that the Euro-zone is showing macroeconomic symptoms not seen here in the U.S.
13:20:20 (UTC)
Tue Jun 23, 2020


Cac 40Slowly but almost surely the Cac 40 will raise again.
Until a second wave is acted we have no worries about the fact, the BCE and the FED will give enough strengh to the markets.
The job here is to find an entry point, nothing else.
Which entry point will be the best ?


CAC 40 index -short /sellbased on the price movement, the price shows a trend continuation upward, so based on my analysis go long according to the chart I published.


CAC40 - Looking for a Gartley to produce FRA40 - Intraday - We look to Sell at 5190 (stop at 5230)
Bespoke resistance is located at 5206. Selling pressure from 5230 resulted in all the initial daily gains being overturned. Buying posted in Asia. Bespoke support is located at 4896. Levels close to the 50% pullback level of 5141 found sellers. Expect trading to remain mixed and volatile. Preferred trade is to sell into rallies.
Our profit targets will be 4997 and 4980
Resistance: 5141 / 5192 / 5230
Support: 5080 / 5052 / 4995


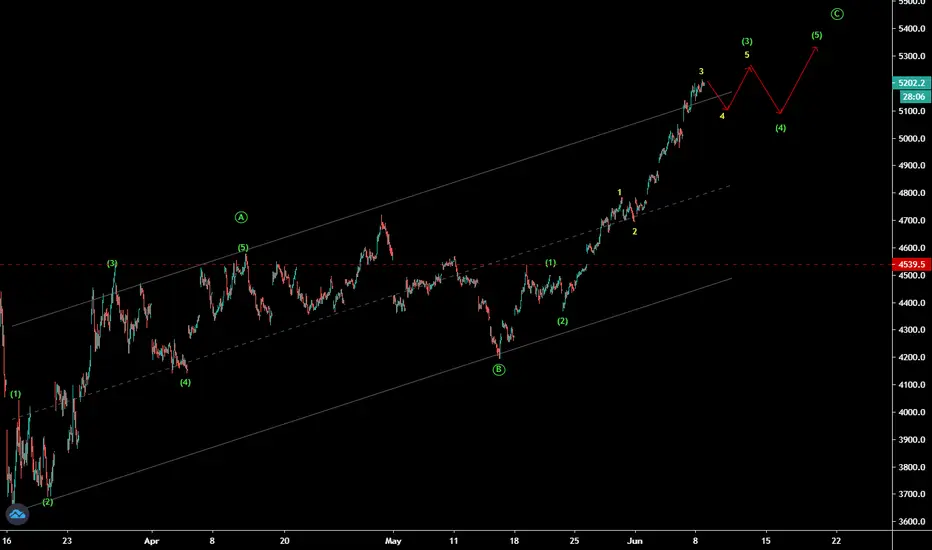
CAC40 (FCHI - Paris) - Updated EW countCAC40 (FCHI - Paris) has completed 3rd subwave of C (or may be impulse). 4th subwave down is now moving down, which may be sharp. Let’s see how charts unfold.
CAC 40 (FRA40) could hit 5140 in wave YThe French index started second leg of double three WXY correction with wave Y, which could hit 5140.
This level represents the equal distance of Y=W and also the 61.8% Fib (5166).

CAC40 - time for a pause or just getting started?Seeing a similar pattern in most European equities. Getting close to a correction or is calling a (interim) top a fools errand and the bullish red count the way to go?


That would be all, short French index by level and RSIThat would be all, short French index by level and RSI
