CAC40 – Bullish Minor 5 – Triple Three PatternMinor 4 (light blue) unfolded as a Complex Triple Three WXYXZ (red) Structure, sliding within a Descending Triangle and forming a Flag Formation right above the upper Triangle Trend-Line, as if it would ‘’kiss it good bye” after it filled the gap and causing a Bullish Divergence.
*Levels, Analysis & Services available for our Members.
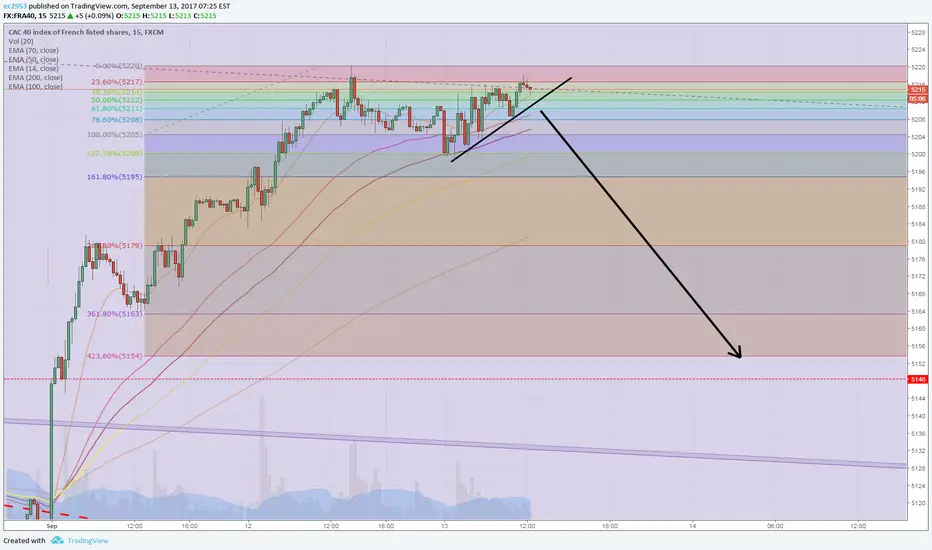
F40 trade ideas


CAC40 in USD : 100% fibo prolongation touched for the 4th timeThis is the the CAC40 index in USD currency (CAC*EURUSD), as viewed by international investors.
As you can see, since the dip in 2009, this pattern happened 3 times. Each time it broke out the resistance (red), the rally did continue to 100% fibo prolongation. The error was less than 50 points. After that the index felt immediately at least 13%.
Now it could be the fourth time ...

CAC-40 jumps to 12-week high, bias higherEuropean bank stocks cheered the prospect of higher Fed interest rates which should help their profits thereby pulling general indices higher.
Frances CAC-40 index jumped to a 12-week high of 5294, bias higher.
Better-than-expected economic data which included flash Euro-zone PMI prints for September also lent support.
Technical studies support further gains. We see bullish divergence.
The index has shown channel breakout and has breached 100-DMA resistance.
Price action now hovering around 61.8% Fibos at 5293, next bull target 5323 ahead of 5339 and then 5374.
Go long on break above 5293, SL: 5259, TP: 5323/ 5339/ 5374

CAC40 Potential New long term channel (Stronger than the DAX)The CAC40 could slide that way (see green circles and 50% Fibonacci levels for mean reversion purposes). You can also check out my previous posts for confirmation

CAC (15 min): from a potential triangle to a wedge to a channelThin air above 5155? Low volume: short! Although analysts aim 5300

CAC40: Thin air above 5155?If we take 5155 down then yup the 5021 area could be the next target. If broken sharply, it's bearish (targets are on previous posts)


CAC40 FR40 Cypher 4h ShortNot bad short-term short opportunity. Cypher formation with RSI overbought I will shoot for it. Stops above previous level of resistence

Long on CAC40Strong white candle breaking the 200 day MA and the bearish flag upper resistance line.


CAC40: Again, here are the next levels (Shorting Phase 2)Check my previous posts on the CAC40.
Those are high probability trades in my opinion.

CAC40 and other European markets: Excellent short opportunity!Top of the channel reached, bad fundamental data everywhere, US markets overshooting because of Trump, Bearish Gartley Pattern + Head and Shoulders pattern on the DAX (see my previous post), and so on.
It's bearish, with a very high probability.

CAC40 4H SHORTNot bad short term short opportunity on the french index. On the RSI the last leg of the moves is signaled as correction. I will go for it. Still not sure where the european equities are heading if up on the take profit target its a nice place to get LONG for a LONG TERM trade

CAC40 Watch trend line for short CAC40 is still in short term down trend. Watch trend line for 886 for short. In case price break up and violate the previous high then it can resume the bullish trend.


France 40 ShortShort @ Current Market Price (5170 levels), Target Price 1 - 5106; Target Price 2 - 5050; Stop Loss - 5210
Reasons: Price in down trend channel; Down trend price structure exists; Price is now rejected at the top band of the channel.
