F40 trade ideas


CAC 40- Breaking resistance going upwardsSeems like resistance around 4600 is broken, which might suggest to test extention levels at 4700 and 4860. Would aim look for buy opportunities, or potentially look for a good long entry when/if retracing back to 4600 area again.

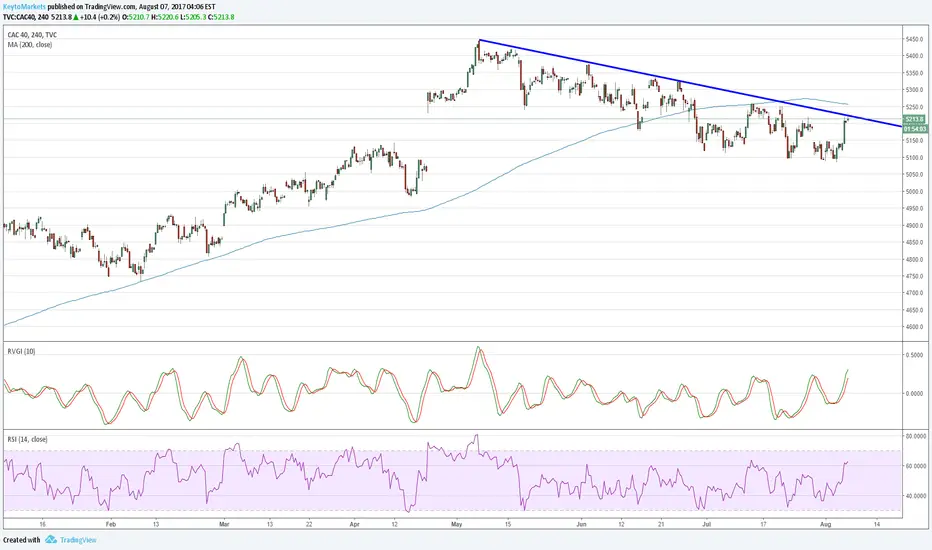
CAC40: On a verge of cross roads.
Rebounds 38.2% (May-July fall)
Daily oscillator appears bullish (inverse H&S pattern)
Weekly resistance seems between 5230- 5285
Propels above 5285, will extend the rally further to 61.8% @5320 and 80.0% @5385.
Support finds at 5160, 5100-5080
Sell below 5080 targets at 5000 and 4970.
2 area to look for potential short Imo those area on the cac will be nice short in possibility of a continuation move toward the lows . 4930 is my target for the next 3 month with invalidation level around 5140 . Trade at you own risk , free trading school coming for september or october


Short CAC 40 and other indices (long term)I can't believe that the invalidated Gartley pattern actually gave very important and extremely accurate Fibonacci levels on the CAC40. I traced the lines last year, and check out the 261,80%, 361,80% and 423,60% levels ... ! Everything above the 423,60% Fibonacci level from the Macron trade was very probably a fake out (bull trap). It would actually be interesting to see a variation of the Island Reversal here.
I would not be surprised to see the CAC hit again the 423,60% then the 161,80% lines ...


CAC Weekly planning to sellCAC Weekly bearish shark + alternate bat + possibly Bollinger Band reversal pattern
This all coincides within a monthly pin bar on the monthly at a very long term S/R level (+15yrs)
Looking for reasons to sell and watching for a indecision or bearish candle on the weekly to short

CAC Monthly Key Level + GartleyKey level going back a very long time with a monthly bearish candle
Looking to short on a shorter time frame


CAC40: It did the total opposite of what I was expecting in 2016Invalidation are as strong if not stronger than validation sometimes.
The interesting thing is that the CAC40 reached the top of the channel (or pitchfork) that I drew last summer. Let's see how it goes, when the DAX and the Dow Jones are making new All Time High.


CAC40 : long TP @ 6200Here is my updated view of the CAC in 4H timeframe.
We are currently on a huge support since it matches with the top of 2015.
If it holds and go beyond the wave 1 (@ 5442), we would go straight to 5750 which is a huge resistance and should then expect a deep retracement.
5950 is also in sight but it is not clear for the moment of the importance of it. Maybe a peak to chase the stops ? Will see when we get there...
In anycase the final target is set at 6200 which corresponds with the end of multiple cycles, including the largest one begun in 2012.


