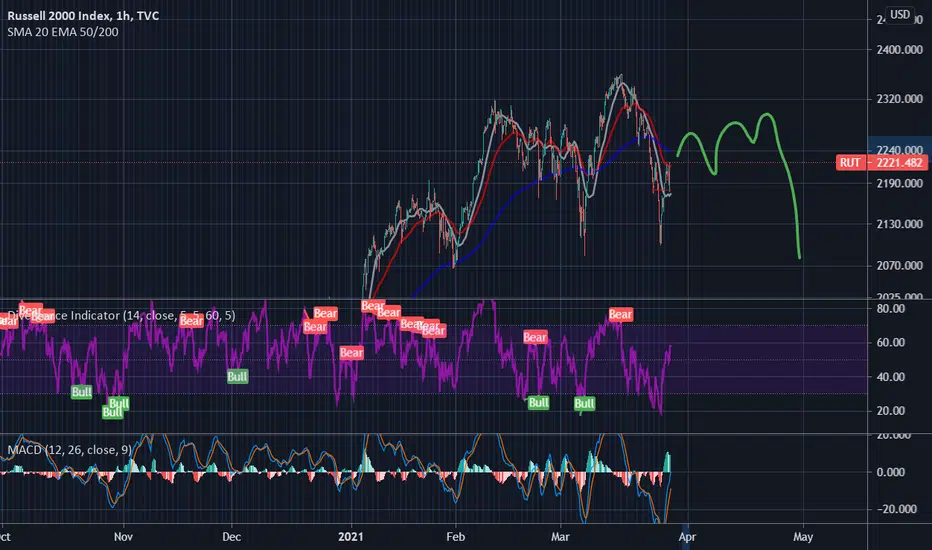
RUT H&SA month ago I posted a chart showing potential H&S on RUT
The right shoulder formed clearly now, making a nice entry with short position.
Im in with TZA since Monday.
US2000 trade ideas

RUT - Russell 2000 on decline? - sharp drop and reverse in play!
Wolfe Wave on 15min - sign of a massive quick drop to support a final major trend reversal
a massive Bat harmonic on DAILY needs to finish
divergence on H&S top on major time frames
similar H&S structure to Feb/March 2000 drop
BLACK SWAN? - a Russia(Belarus & Turkey) WAR against Ukraine

Russell 2k - LONGLower bound of calculated range on price and volatility, potential nice wave pattern forming. Needs a little room its been the laggard of the indices, but so so was Nat Gas or XLK for a while, then kapow, the vol sinke and the consolidation ends and the rally ensues. Patience is key. Will post update with SL and another chart, we had our fill in futures at 2211. Todays calculated range 2229-2271. Also, SPX implied vol premium is high while it too is near the low end of its calculated range. These are positive or bullish signs.

Russel is lagging but may reach 3,000 Russel 2000 does not demonstrate strength yet, and the most probably scenario - it to go towards 2,000 level first before the uptrend resumption. That will be a perfect level to buy in with target around 3,000 which is the upper line of multi year channel.
If the wave count is correct, then we are in the 4th wave, which should be a zig-zag, as per rule of alternation since wave 2 has a flat structure. So, one more leg down is missing, and we can see that price is experiencing problem with making new high while S&P500 and Dow are rising.

US2000USD: RUSSELL Elliott wave and chart pattern analysisThis possible Elliott structure is for your consideration
Trade according to YOUR PLAN.

RUT Triangle forming --- breakout or breakdown coming?RUT has been in a wide trading range, triangle is very clear, looks to come to a breakout or breakdown soon. Which way?
Iron Condors these past 2 weeks have been profitable.

Russel 2k - LONGEarnings and growth accelerating across the board and expect it to continue combined with a nifty little 1hr correction or pullback may present a nice opportunity for entry here.

Russell 2000 Holding the 50-day SMAThe Russell 2000 had a strong move coming out of the vaccine news in November. It’s been consolidating for the last two months and now may be ready to continue higher.
The main thing jumping out of today’s chart is the 50-day simple moving average (SMA). RUT tested it in early March and has chopped on either side of it since. But now prices are trying to hold it as they squeeze into a tight range.
Second, notice the relationship with the 10-day SMA, which is rising up toward the 50-day SMA. Other times when it crossed above in May and October were followed by periods of strength.
Finally, notice how the MACD histogram has inched back from bearish toward neutral. Like the 10-day SMA versus the 50-day SMA, it hasn’t crossed yet. But it could be worth watching.
Overall, the data seems to be confirming the economic recovery and restrictions are loosening in various jurisdictions. Small caps have been one of investors’ favorite ways to position for that reopening trend, so buyers may return as the summer approaches.
TradeStation is a pioneer in the trading industry, providing access to stocks, options, futures and cryptocurrencies. See our Overview for more.

inside trend breakout!we are overall in a sideways market on a bigger picture, however we have a inside trend breakout.

Buying Russell2000. Buy stop @ 2264,50 for RR 1:2Russell2000 is moving up on daily. On 1h chart it bounced off channel support. The target is 1h up fib 1,618 D extension. Stop below recent ABCD A.


RUT Bullish wave (5) RUT daily chart shows small caps is setting up for a wave (5) rally that could reach 2528. Up to the daily time frame and above, the RUT remaining bullish against the wave (C) support level at 2100 for now. We are interested in establishing long positions like a bullish vertical that expires in May 2021.

US2000 RUSSEL POSSIBLE HEAD & SHOULDERS !!!Hi,
There is a good opportunity, IF everything goes on what we see in the chart, to get risk/reward ratio on #US2000

RUSSELL 2K for a move to 2k?Small caps have underperformed of late and price action in the Russell is testament to that. We've seen three bearish outside days this year, and granted the sample size isn't huge - a function of viewing this on the daily - but in the prior two episodes, we saw the index fall around 9.5% on average in 7 trading sessions. With bond yields creeping higher, amid ISM manufacturing and NFPs due this week, will small caps continue to see outflows? If we see follow-through and price through yesterdays low then 2k could well be on the cards

Buying Russell2000 on the break of 1h counter trend line breakRussell2000 is in uptrend on Daily chart. It broke above 1h down channel resistance line and got into BUY ZONE on daily. On 1h it is starting to move higher. Buying Russell2000 on the 1h counter trend line break bullish in the BUY ZONE. Target - 1h fib ABCD D extension. Stop = below current 1h fib ABCD A.

Russel may be at the last push before reversalLast leg down closed bearly higher then the one before, I can see steam running from it.
It may be making hourly H&S, so watch for it.
Spy and QQQ will go higher before reversal, but if I see weakness in RUT over next 2 weeks it will be a sign for me that general market reversal is near.
For next week I think will go up.
I took large position with TNA on Friday before that crazy green candle was printed, so Im going to swing it for next few days.
Good luck everyone
If you like my idea, Please follow me.
Thank you

Today the russel was much stronger than the other marketsI am trying to find a valid entry method even if the hourly bar does not close above the POC.
On the Russel the reversal was clear, the new now was immediatly bought.
So entries on reversal area much better traded on the lower 5 min time frame anticipating a trade above the POC.

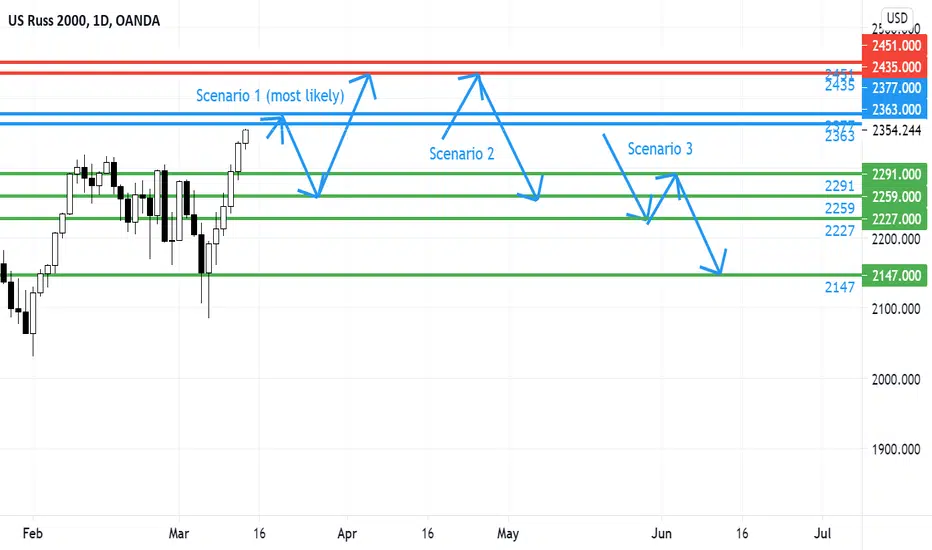
Weekly Analysis for #RUT for 15-19 March 2021Trend: Daily/Weekly/Monthly: Up/Up/Up
RUT is strongest of the 3 US indices. Expect rotation to continue and RUT to lead. I don’t and can’t call tops. But some signs point to pullbacks.
3 possible scenarios:
1) As long as 2363-77 resistance zone holds, look for shorts targeting 2259-91 support zone. This zone should hold for a next leg up, to 2435-51.
2) We have a fast rally from open to 2435-51 resistance zone, by Tuesday or Wednesday, where we see a sharp rejection for a strong move down to 2259-91.
3) We open in Globex and sell off start, targeting 2227 before a bounce to 2259-91 and further selling to 2147
IMO, scenario 1 is most likely.

RUSSELL 2000 is leading S&P 500The RUT/S&P 500 ratio’s monthly, weekly and daily charts are presented. ___
Prompt: New traders should take some time and carefully read the post entitled 'You can't beat the market' that is located in my profile.
Disclaimer
The author of this text is not an investment advisor. The preceding content is intended to be used for informational and educational purposes only.
It is not an advice or inducement for the purchase or sale of the products mentioned. Before making any investment based on your own personal circumstances,
it is very important to do your own research and analysis and also take independent financial advice from a professional to verify any information provided here.

Swing Trade Russel, still long but trying to exit at double topEntered the daytraded above a green 1 hour bar above the POC line, exit not on a trailing stop but with limit order at the top of a large red 1 hour bar...
