US30: Will the Channel Hold? Trading the Intraday StructureUS30 1-Hour Analysis - Potential Trading Setup
Technical Outlook — 11 April 2025
Current Market Condition:
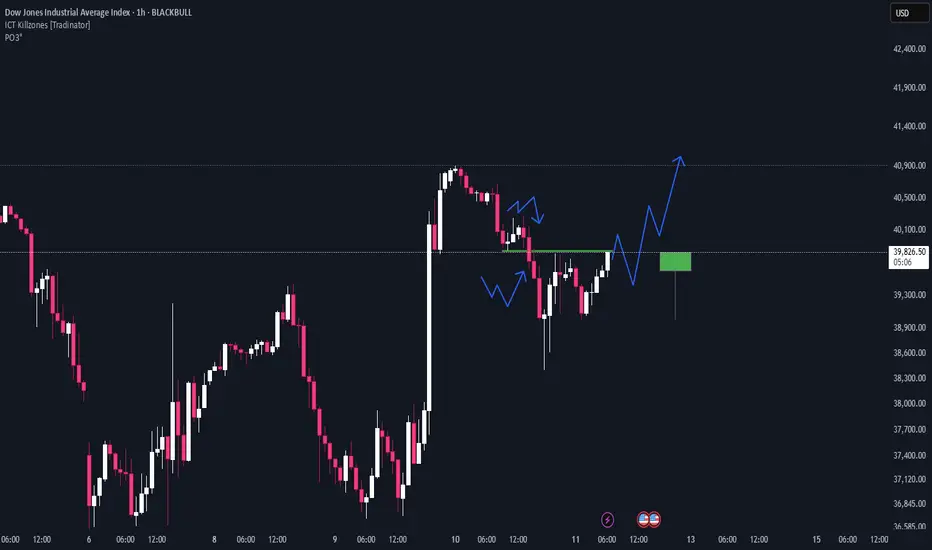
US30 on the 1-hour timeframe is currently trading within a short-term ascending channel, showing a recent test of the upper trendline. The price is now exhibiting signs of potential bearish pullback within this channel.
Potential Trading Setup:
Bearish Pullback Setup (Primary Scenario):
Entry: Look for confirmation of bearish rejection from the upper ascending channel trendline. This could be in the form of bearish candlestick patterns (e.g., bearish engulfing, pin bar) on the 15-minute or 30-minute timeframe after testing the channel top.
Stop Loss: Place a stop loss above the high of the rejection candle or above the upper channel trendline to protect against a potential channel breakout.
Take Profit Targets:
TP1: The middle of the ascending channel (currently around 40,600).
TP2: The lower trendline of the ascending channel (currently around 40,300 - 40,400).
Potential TP3: If the channel breaks down, the next support zone around 39,800 - 39,900.
Rationale: Trading within an ascending channel often involves buying at the lower trendline and selling at the upper trendline. The recent rejection at the channel top provides a potential short opportunity for a pullback towards the lower trendline.
Bullish Breakout Setup (Lower Probability, Requires Strong Confirmation):
Entry: Consider a long entry only upon a strong and sustained break above the upper ascending channel trendline (around 41,000). Look for strong bullish candlestick patterns and increasing volume on the breakout.
Stop Loss: Place a stop loss below the low of the breakout candle or below the upper channel trendline after it has been broken.
Take Profit Targets:
TP1: Previous swing highs or resistance levels above the channel (refer to the chart for specific levels).
Rationale: A breakout from the ascending channel could signal a continuation of bullish momentum, but requires strong confirmation to avoid false breakouts.
If you found this analysis valuable, kindly consider boosting and following for more updates.
Disclaimer: This content is intended for educational purposes only and does not constitute financial advice.
US30 trade ideas

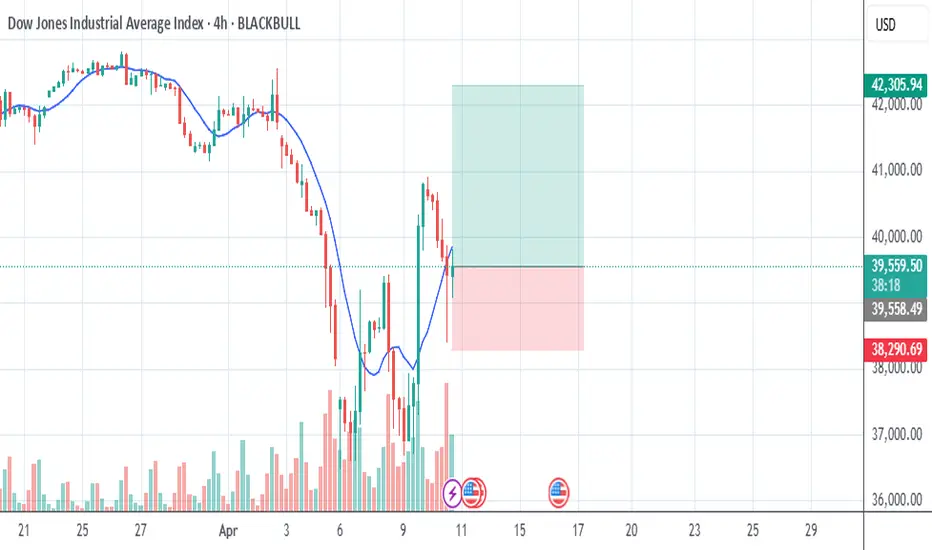
DJI REJECTION OPTIONLooking at the DJI - I see this as a worst case scenario. From here I would rather see a complete rejection of this red candle or a long swoop. if we follow the path here, a rejection would see a significant down trend begin. Lets hope we break out.

11/04/2025 us30 nq es ///read description pls ///yesterday i share with u why market should go down and go up already explain it in the last post go check it in my profile
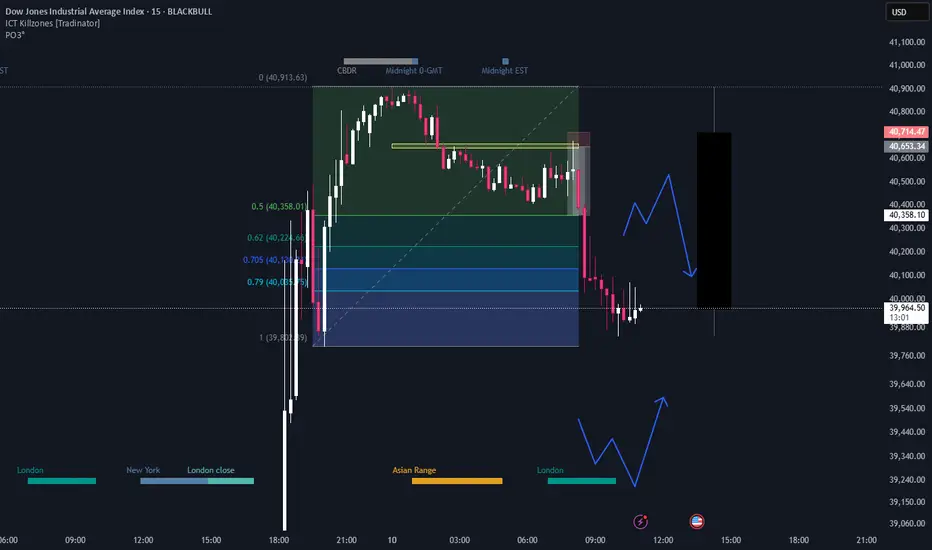
now were waiting confirmation
this is not trade this just my vision to market and u should be aware we have news and last day of the week
dont take it as trade . cause we dont have confirmation yet its just a vision we need confirmation to take this trade
ill keep u update if we get confirmation in this post
never ever risk more than 1% from ur capital a day
respect ur plan even if ur plan goes wrong
any question feel free
be safe
US30 Outlook – April 11, 2025📉 US30 Outlook – April 11, 2025
US30 has staged a sharp V-shaped recovery from the recent low near 36,743, climbing back over 39,500. However, bulls are now showing signs of exhaustion after failing to hold above 40,000, a key psychological and structural level.
🔍 Chart Analysis:
✅ Strong recovery with bullish EMAs crossover
❌ Multiple rejections at the 40,000 handle — turning it into short-term resistance
🧨 Price forming lower highs after the spike — hinting at weakening momentum
🔻 Key support zone sits at 38,800–39,000, a break below opens downside
🧠 Outlook Summary:
Bias: Turning neutral after a strong bounce
If 40,000 is reclaimed and held → Bullish continuation toward 40,800 / 41,200
If price breaks 38,800, expect a retrace to 37,700 / 36,743
🎯 Key Levels:
Resistance: 40,000 / 40,800 / 41,200
Support: 39,000 / 38,800 / 37,700

correction A correction and fluctuation trend is expected to form within the support levels, then the start of the upward trend is likely.

us30 buy tradeThe Relative Strength Index (RSI) is showing an upward trend, indicating increasing momentum. Additionally, the Moving Average Convergence Divergence (MACD) is showing a bullish crossover, further supporting the potential for an upward move.
Dowjones Short AnalysisDow is in downtrend now. I have used various technique in analysis. Sl is the rectangle top. And target is below arrow.
❤️ If you find this helpful and want more FREE forecasts in TradingView
. . . . . Please show your support back,
. . . . . . . . Hit the 👍 LIKE button,
. . . . . . . . . . Drop some feedback below in the comment!
❤️ Your support is very much 🙏 appreciated!❤️

BULLISH PRESSURE US30All details are in the picture itself. If you have any questions feel free to message me.

Dow Jones - Value Is The King Of 2025!Dow Jones ( TVC:DJI ) withstands all bearish struggles:
Click chart above to see the detailed analysis👆🏻
All major U.S. indices have been weakening lately but the Dow Jones is clearly the strongest of all. It seems like big institutions are shifting back to value stocks and therefore the Dow Jones remains very strong. Looking at technicals, this trend is rather likely to continue during 2025.
Levels to watch: $40.000, $50.000
Keep your long term vision,
Philip (BasicTrading)

DOW JONES: High volatility but clear picture long term.Dow Jones turned bearish on its 1D technical outlook (RSI = 40.021, MACD = -1063.380, ADX = 32.380) as it is correcting brutally yesterday's gains on uncertainty regarding the 90-day pause of tariffs. We can't overlook however the fact that yesterday's rebound happened on the 1W MA200 and at the bottom (HL) of the Bullish Megaphone. The very same sequence of events unfolded during the last big U.S.-China trade war that bottomed in December 2018. First a Channel Down bottomed on the 1W MA200 and started the Bullish Megaphone that bottomed on the 2018 trade war.
Both trade war corrections were -19% and if what follows replicates the 2019 rise, then we are up for a +35% rally. Potential TP = 49,000.
## If you like our free content follow our profile to get more daily ideas. ##
## Comments and likes are greatly appreciated. ##

Trade Idea: US30 Short ( MARKET ) Daily Chart (Macro View):
• Bearish divergence: RSI is at 47.38 and turning down — no strong bullish momentum.
• Recent bounce is sharp but came after a massive drop, suggesting a dead cat bounce or retracement.
• MACD remains heavily bearish (-836), showing underlying weakness despite the current bounce.
• Price recently rejected a key resistance near 40,850, aligning with previous support-turned-resistance levels.
15-Min Chart (Medium-Term):
• RSI is at 78.76 — overbought territory.
• Price surged parabolically, forming potential exhaustion.
• MACD shows very high positive values (672.341), usually precedes a correction.
• Potential bearish divergence between price and MACD.
3-Min Chart (Entry Timing):
• Price has stalled at the top, consolidating after an extreme spike.
• MACD and RSI are curling down.
• Ideal for timing a short entry.
⸻
Trade Idea: SHORT US30
• Entry: 40,850 (current resistance zone + psychological level)
• Stop Loss: 41,200 (above key recent highs / invalidation of setup)
• Take Profit: 39,450 (near broken structure & moving average support on lower timeframes)
Risk-to-Reward Ratio (RRR):
• Risk: 350 points
• Reward: 1,400 points
• RRR: 4:1 (excellent)
⸻
Fundamental Context (Supporting the Short Bias):
• Dow is rebounding amid broader market uncertainty (e.g., Fed rate trajectory, inflation prints).
• No strong economic catalyst justifying a sustained breakout to new highs — suggests technical bounce rather than trend reversal.
• Rising yields or a hawkish Fed outlook could reintroduce selling pressure.
FUSIONMARKETS:US30


US30 - BullishUS30 formed a double bottom and broke its neckline confirming bullish reversal. Now it is testing 0.5-0.618 Fib level of its last bullish leg.

Strong downward momentum visibleTrend: Strong downward momentum visible prior to current consolidation.
Setup: Price has bounced slightly and appears to be retesting a broken structure (possible resistance at ~40,000).

US30: Target Is Up! Long!
My dear friends,
Today we will analyse US30 together☺️
The recent price action suggests a shift in mid-term momentum. A break above the current local range around 39,680.80 will confirm the new direction upwards with the target being the next key level of 40,416.97 and a reconvened placement of a stop-loss beyond the range.
❤️Sending you lots of Love and Hugs❤️

Dow Jones US30 - Buy Cycle- SpotUS30
Spot
Buy cycle
Tp@44989
% bubble ratio
Dowjones in long term negative bubble (buy cycle), closing target at 44989 as its fair value.
Spot trading plan:
Starting to buy at -50% bubble ratio and below

US30: Downtrend vs. Support Battle - What's Next?US30 Daily Analysis
Technical Outlook — 10 April 2025
Current Market Condition:
US30 is currently in a defined downtrend on the daily timeframe, characterized by a series of lower highs and lower lows. The price has recently broken down from a potential bearish wedge pattern and is trading below key moving averages.
Key Technical Highlights:
Clear bearish structure evident with consecutive lower highs and lows.
Price has broken down from a potential bearish wedge formation, suggesting further downside.
Trading below the 50-day and 200-day Exponential Moving Averages (EMAs), indicating bearish momentum.
Key Support Zones identified around $37,000 - $37,500 and $35,800 - $36,200.
Key Resistance Zones located around $42,000, $45,000, and $47,800 - $48,000.
Momentum oscillator (MACD or similar) showing bearish momentum.
Possible Scenarios:
Bearish Scenario (High Probability):
If price remains below the descending trendline (around $40,000 - $41,000) and fails to reclaim the $37,500 level, expect bearish continuation.
A confirmed break below the $37,000 - $37,500 support zone could lead to targets at the $35,800 - $36,200 support zone.
Confluence of the bearish trendline and moving averages adds to the potential selling pressure.
Bullish Scenario (Invalidation Level):
A break and sustained trading above the descending trendline and the $42,000 resistance level could signal a potential short-term pullback towards higher resistance levels around $45,000.
Strong bullish reversal signals within the $37,000 - $37,500 support zone could also indicate a potential bounce.
Important Note:
Be aware of any upcoming economic data releases that could impact US indices and cause volatility.
Wait for clear candle confirmations at key levels before initiating trades.
Implement robust risk management strategies, including appropriate stop-loss placement.
If you found this analysis valuable, kindly consider boosting and following for more updates.
Disclaimer: This content is intended for educational purposes only and does not constitute financial advice.

Dow Jones INTRADAY oversold bounce back Key Support and Resistance Levels
Resistance Level 1: 41100
Resistance Level 2: 42170
Resistance Level 3: 42800
Support Level 1: 37554
Support Level 2: 36620
Support Level 3: 35125
This communication is for informational purposes only and should not be viewed as any form of recommendation as to a particular course of action or as investment advice. It is not intended as an offer or solicitation for the purchase or sale of any financial instrument or as an official confirmation of any transaction. Opinions, estimates and assumptions expressed herein are made as of the date of this communication and are subject to change without notice. This communication has been prepared based upon information, including market prices, data and other information, believed to be reliable; however, Trade Nation does not warrant its completeness or accuracy. All market prices and market data contained in or attached to this communication are indicative and subject to change without notice.

NFP NQ / US30 advise for u read description i took this trade today early now the market should react from one of this places i mention, pls be aware never ever take the trade before NFP /15 min before / always wait NFP and market will gave u other entry after 45 to 60 min after NFP dont be gambler and put all ur heart . Wait like pro and take trade after nfp 45 to 60 min be safe much love and respect
any question fell free to ask id like to answer any Questions
DOW JONES INDEX (US30): Bearish More From Resistance
It looks like US30 is returning to a bearish trend again.
I see a strong bearish sentiment after a test of a key daily resistance.
The price formed an inverted cup and handle pattern and we see
a strong bearish imbalance with London session opening.
Goal - 39.685
❤️Please, support my work with like, thank you!❤️
I am part of Trade Nation's Influencer program and receive a monthly fee for using their TradingView charts in my analysis.

Us30 LongWe have a fresh/original zone at 40150 of which i expect price to pull back to and reject it and continue with the rally


FXBG JOURNAL (US30 SHORT) 9/04/2025 BEFOREFollowing Bearish Price Action . Decided to take shorts from the recent bearish Orderblock.
