NASDAQ Potential UpsidesHey Traders, in today's trading session we are monitoring NAS100 for a buying opportunity around 23,140 zone, NASDAQ is trading in an uptrend and currently is in a correction phase in which it is approaching the trend 23,140 support and resistance area.
Trade safe, Joe.

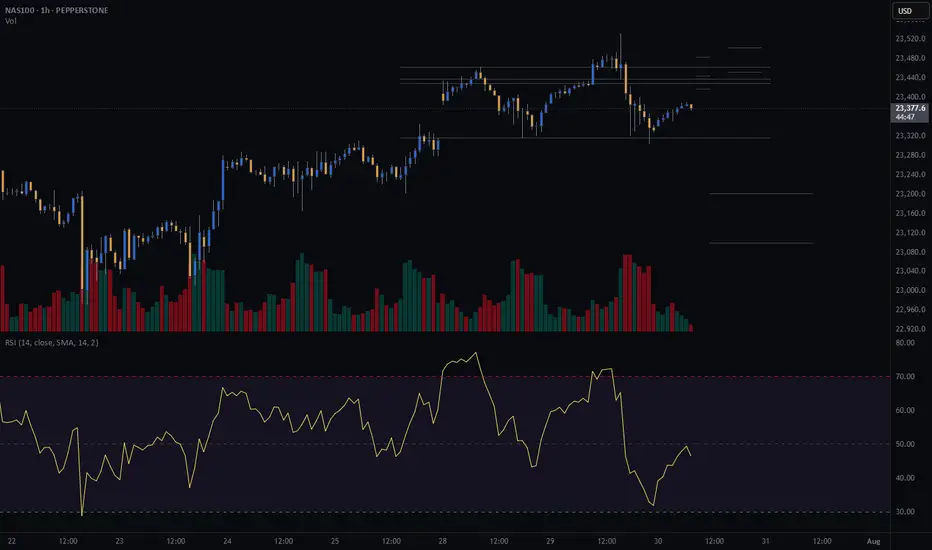
NASDAQ INDEX (US100): Another Gap For Today?I anticipate another gap up opening on the 📉US100 Index, which I believe will be filled today.
The formation of an intraday bearish change of character(CHOCH) on the hourly chart
This indicates a strong likelihood of continued bearish movement, with a target of 23319.

NASDAQ Potential UpsidesHey Traders, in today's trading session we are monitoring NAS100 for a buying opportunity around 23,300 zone, NASDAQ is trading in an uptrend and currently is in a correction phase in which it is approaching the trend at 23,300 support and resistance area.
Trade safe, Joe.

The Markets, the Rabbi and the Goat...It’s funny how sometimes markets react like people in old jokes…
They scream when things get bad, then cheer wildly when things return to how they were — as if something amazing just happened.
Let me tell you one of those jokes.
It’s about a house, a rabbi… and a goat.
A man goes to the Rabbi:

NASDAQ Channel Up to be rejected soon.Nasdaq (NDX) has been trading within a Channel Up since the start of the month. The primary Support level has been the 4H MA50 (blue trend-line), which hasn't closed a 4H candle below it since July 14.
Right now the index is on its latest Bullish Leg, which can technically extend by +2.35% (max suc

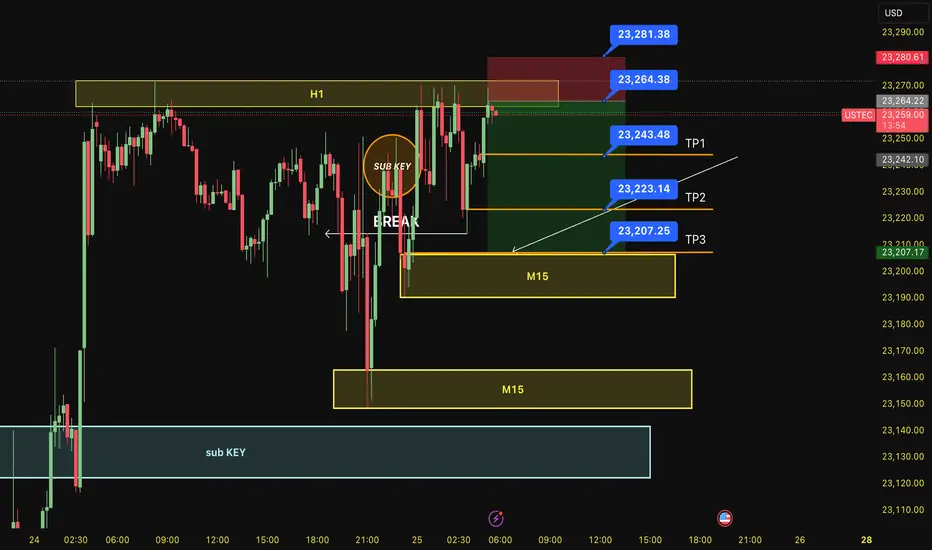
SELL USTEC 25.7.2025Reversal trade order: SELL at H1~M15 (all-time high - ATH)
Type of entry: Limit order
Reason:
- The price breakout the sub key of M15, confirming it will hit the main key M15.
- There is a key H1 support at the entry point.
Note:
- Management of money carefully at the price of bottom of M15 (23,343)
CASH100 (NASDAQ) CRASH - Head and shoulders Risk/reward = 3.7
Entry price = 23 430
Stop loss price = 23 503.2
Take profit level 1 (50%) = 23 202
Take profit level 2 (50%) = 23 099
Still waiting for some variables to confirm before entering the trade
NAS100 - Update Dear Friends in Trading,
How I see it,
I will be waiting for a clear and decisive break below the PIVOT.
Keynote:
I am not trading NASDAQ at all...just monitoring patiently!!
I will keep you in the loop as the stock market progress...
I sincerely hope my point of view offers a valued insight
Th

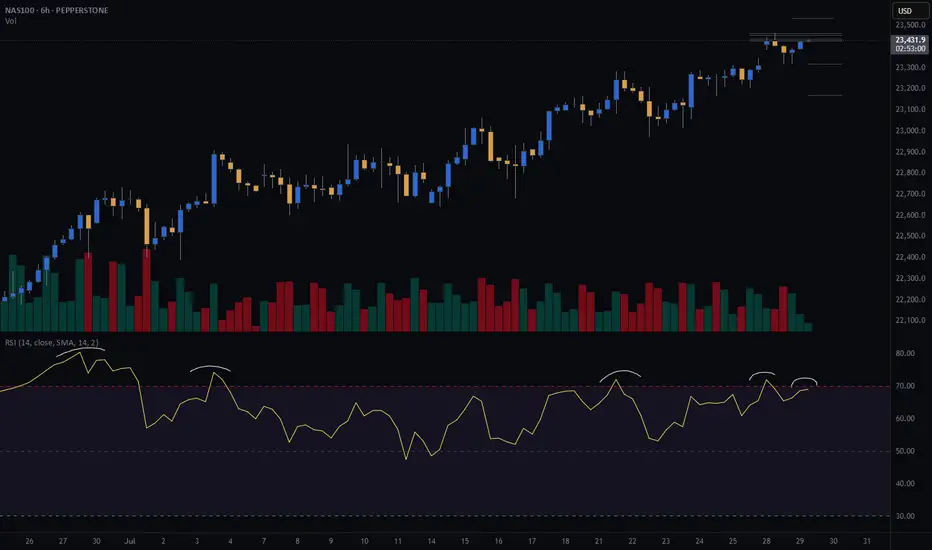
NASDAQ (CASH100) SHORT - Double top H6Risk/reward = 4
Entry price = 23 463.1
Stop loss price = 23 534.2
Take profit level 1 (50%) = 23 169
Take profit level 2 (50%) = 23 169
All variables met. Now just need price to reach entry level and close back within range.
NAS - LET'S MAKE MILLIONS Team, last night NAS I was expect the FALL BACK as I predicted rate un-change will get NASTY on both DOW AND NAS.
So I have a set up entry LONG, i didnt expect the NAS flying to the moon.
both target hit so fast in 15 minutes
However, today is another opportunity to SHORT NAS on the current market

See all ideas
Displays a symbol's price movements over previous years to identify recurring trends.