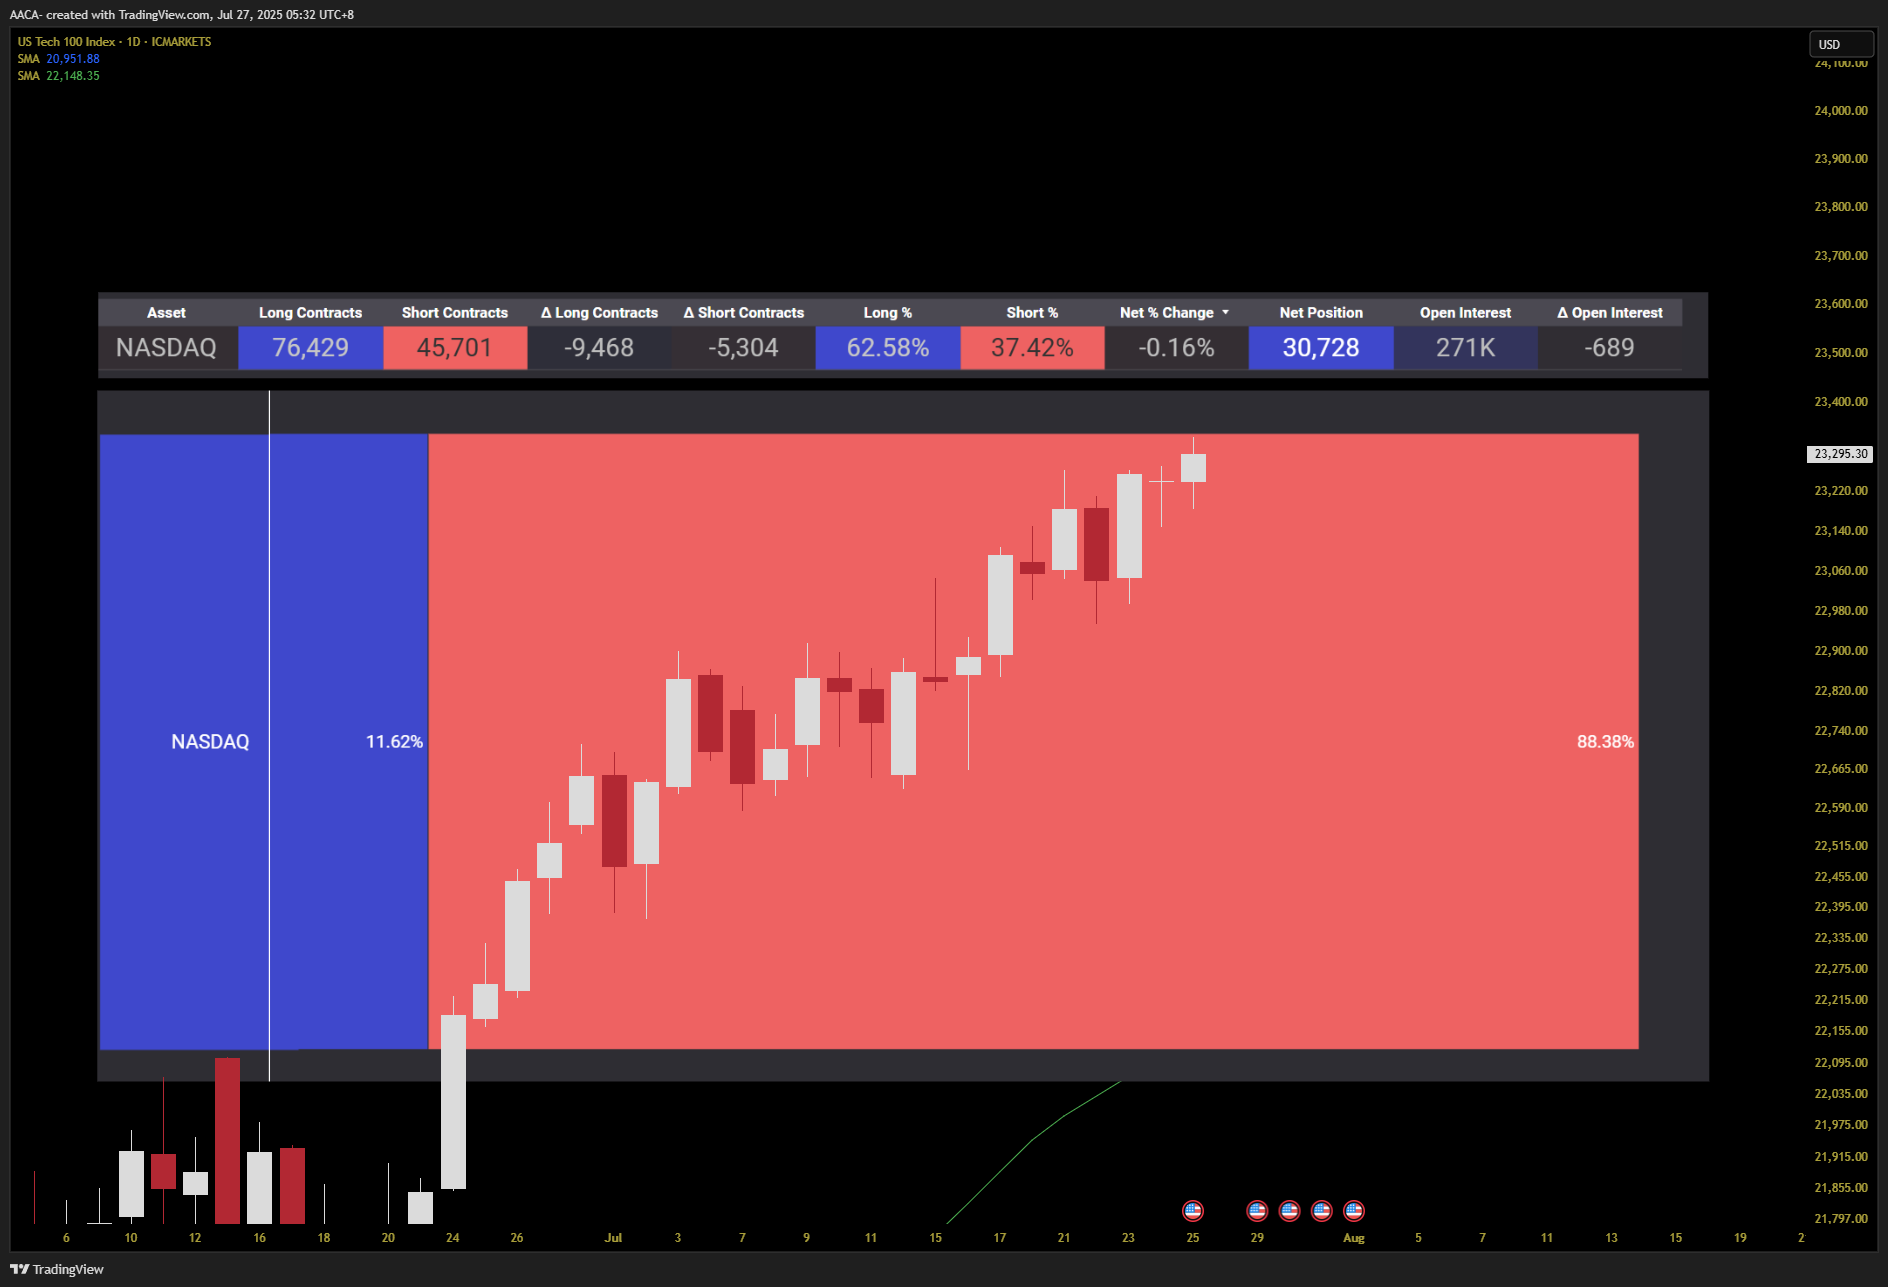
USTEC No change in ratio of Long / Short contracts from institutions. Closing my buy limits. Waiting for further development in data. Institutions: 62% Long 37% Short Retail: 11% Long 89% Short
US100 Ok, regarding tariffs, I'm not an economist, I don't understand it, but from what I've been researching, it looks like another episode of The Simpsons - Temporary Refund Adjustment. Is there anyone here who understands this? Or is there a source where it would be well explained? Because in the case of Japan, it seems to me that what is being reported in the media is completely off the mark, like according to Lutnick, Japan will give America 550 billion? Just like that. Sorry if this doesn't belong here. My head hurts
NDX Been trapped for weeks now — I'm a knobhead! I knew when I should have got out, but thought to myself "it will retrace anytime soon, it has to", but no, it didn't (obviously!... why should it?). Been caught out before — this time, I really f*cking hope I've learnt my lesson!... I feel I have.
BTW (for those who are even remotely interested), I've traded for a few years now, and quite good — but often blow weeks of profit and hard toil on one, stupid, f*cking trade — where ego, once again, kicks me in the bollocks!.... that is the reality folks!
I reckon trading is probably one of the only ways of making money where it can be/could be, so easy ("when done right"), yet so really difficult at the same time??
I'm sure there is plenty of us out there — I'm so, so close to making it work!