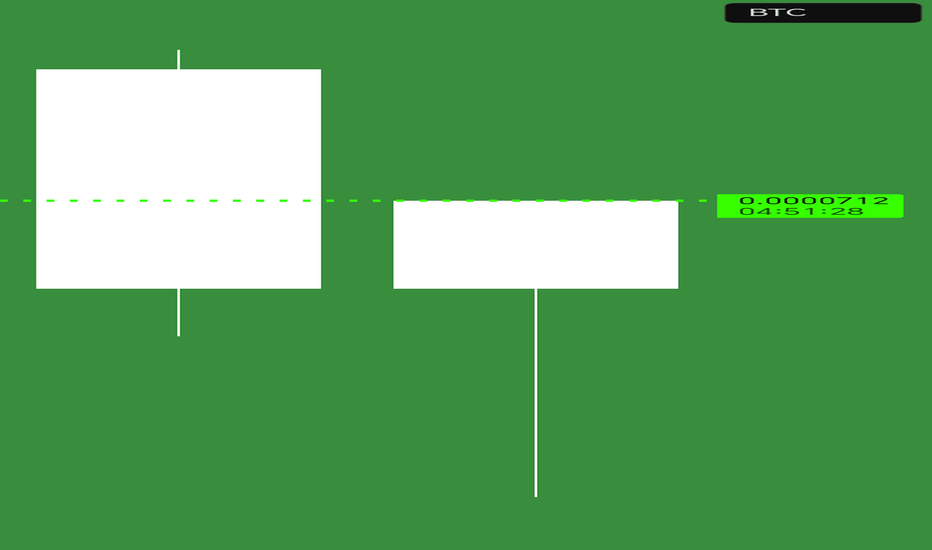
It places the lotion in the basketDiversify ur eggs
It starts from the Daily, the Indica causes lag that bleeds to the weekly,
All magic trick involve distraction,
Darkest before the storm
And bunch of other corny phrases,
This dwell was a Deep one, is it a wishing dwell, I C no P,
Writings on the wall, red
Nah nah
Macd needs to
Related coins
This altcoin will 2X BTC performance in next few monthsIt just woke up from the lows. BTC's dominance is going down, and Ohters' dominance is up. This is great Alt-season play.
you are welcome to comment with your thoughts and share your charts or questions below, I like any constructive discussion.
What is CLS?
This company is trading for the biggest
The ICP/BTC pair is in a multi-year bullish divergenceThe ICP/BTC pair is in a multi-year bullish divergence. If Bitcoin reaches $230,000 at its peak next year and #ICP returns to the opening price of its first monthly candle, which is 0.0043210 BTC (yellow line) per CRYPTOCAP:ICP , it will equivalent to $993.83 per ICP. It means you would only need
Internet Computer: A Strong Project (400%+ BU-Wave Predicted)A strong project? How, why? Explain!
Hello my fellow Cryptocurrency money-maker, I am hoping you are having a wonderful week.
The Internet Computer is a strong project because it is part of the TOP100 by market capitalization; but, here, the reason why I consider this pair "strong" is because of t
btc 40kif 1 acquires 0,05 worth of btc now w a price of around 28k costing u 1300ish and puts it into icp,
there is a target for icpbtc +500% , (also in the same date and zone in icpusdt chart 25$)
ones btc would increase to 0,25
your initial 1300ish would 8ish X to roughly 10k
so 0,25btc would b 10k so
1
Internet Computer weekly falling wedgeICP weekly has formed a bullish falling wedge pattern which has a high probability of breaking out to the upside If the worst is behind ICP and this looks the case now then this breakout might see some nice gains off the bottom Risk tolerance differs greatly between individuals but we see a high ris
See all ideas
Summarizing what the indicators are suggesting.
Oscillators
Neutral
SellBuy
Strong sellStrong buy
Strong sellSellNeutralBuyStrong buy
Oscillators
Neutral
SellBuy
Strong sellStrong buy
Strong sellSellNeutralBuyStrong buy
Summary
Neutral
SellBuy
Strong sellStrong buy
Strong sellSellNeutralBuyStrong buy
Summary
Neutral
SellBuy
Strong sellStrong buy
Strong sellSellNeutralBuyStrong buy
Summary
Neutral
SellBuy
Strong sellStrong buy
Strong sellSellNeutralBuyStrong buy
Moving Averages
Neutral
SellBuy
Strong sellStrong buy
Strong sellSellNeutralBuyStrong buy
Moving Averages
Neutral
SellBuy
Strong sellStrong buy
Strong sellSellNeutralBuyStrong buy
Displays a symbol's price movements over previous years to identify recurring trends.


