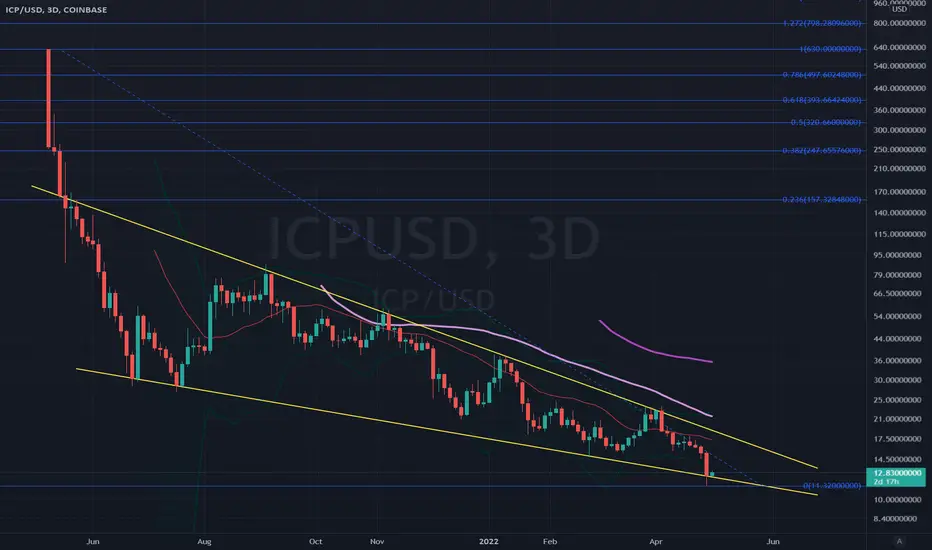
New Low - New Logarithmic Triangle Its really hard to step back and take a view of ICP because it came down so far, so I switched to Logarithmic scale and it showed more detail and squashed the giant arterial red blood stain on the left of the chart.
When I did a Log scale a different, pattern emerged that fit a triangle better than Normal scale.
The price has touched the top and bottom four times...not sure what this means but oh well, I like making pretty pictures!
Make sure to visit: "'Tis but a scratch." and "PAMP IT!"
ICPUSD trade ideas
ICP, What Next? ICP has had a dismal debut in the crypto markets. A listing dump, a long downtrend, and a dwindling market cap; ICP now sits roughly 98% below value of Coinbase listing.
Internet Computer is a Web 3.0 blockchain project that has a lot of potential. I believe positive news and a growing user base is coming. It's only a matter of time. It is the world's first blockchain that runs at web speed with unbounded capacity.
ICP is ranked #37 on CMC with a market cap of 4.3B at the time of writing.
I am following price action to determine if a bottom and accumulation will be formed and a new uptrend born. Recently, I am happy to see no massive moves have been made as other cryptos have experienced sharp bounces from recent lows. Slow and steady will form the foundation for a lasting rise.
IF ICP can make it back into the top 10 cryptos it has potential to offer 10x+ gains from current prices.
--For example ADA has a market cap currently of 38.4B, ranking #7 ahead of SOL with a market cap of 34B. (BNB and ETH 70B and 365B respectively.)
Compare to ICP current 4B market cap I'm sure you can see the potential.
I have begun to make some small purchases with the intent of a long hold.
ATL currently $18.11 - It is yet to be seen if we have found the bottom.
Thank You for reading my post.
No Guarantees
DYOR
Trade Safe, Trade Happy

ICP to $9?A lot of alt coin charts are looking the same. Bearish price structure with indicators flashing bearish signals.
The daily RSI recent broke down out of a line of support it established back in December and it looks like we just had a bearish retest.
All of this combined with current market sentiment is telling me that there could be real capitulation before we break higher.
In my opinion we could head down to the falling wedge line of support before we break higher. Right now that support is at around $9.


ICP needs to range sideways to gain buyer confidenceICP has been one of the worst performing assets in the market. However, it has very strong fundamentals with a ecosystem that is growing at breakneck speeds.
With all of the mistrust surrounding ICP in the markets, I think ICP in the short term is likely to visit ~$22, but NEEDS to range sideways for a considerable time gain buyer confidence again and make serious moves to the upside. The seller momentum is likely to be be high still and any gains seen may be quickly erased.
So if ICP ranges sideways for a month or two it is likely to attract more buyers to and gain real momentum in the upside again. Bulls need to defend the $15-17 support range.


ICP 10%+ gain entry incomingToday I'm doing something a little differently. I've decided to let the charts speak in detail instead of a lot of words. If I have something special to say about the specific instrument. I will mention it here. For general Crypto updates, please take a look at my BTC update.
One thing to keep in mind is that we are in a short-term downward wave today and we haven't reached the end of it.

Icp in a nice spot for up move!Hello, this structure has a very nice structure for a nice move up . Don 't miss it!

ICP will surprise us all . . .Another thing rarely factored into the Crypto price volatility v regular investments (from what I read ) is that , unlike many types of regular investment , which takes days to come into effect, the largely independent Crypto trader can jump in and out within seconds, 24/7/365 . .
This factor in itself is revolutionary, I still get a buzz buying some more ICP at these give-away prices while half-way up a mountain on a Sunday hike !! . .Hardly surprising the conventional Financial World, like the Banks, are frozen in terror of DEFI/CRYPTO . .tech has finally replaced them - they are superfluous /redundant . .and they know it !!!. .Buy on Brothers and Sisters, the writing is on the wall . .the cats out of the bag, the genie is out of the bottle . .no one is able to stand in the way of this revolution . .the people are voting with their money . .and this is just the start !!
OF COURSE Crypto is volatile - and that goes both ways, people like it . .a fast moving World needs fast moving systems . .the business potentials lying dormant within the Crypto concept are simply mind-blowing...the Smart Contract aspect itself is one of the most revolutionary social advancements of the past 300 years !!!

ICP PRedictionIts looking good at the moment, been watching this for a while- lets see how it plays out.
So long as the SPX doesn't drop I'm feeling confident.


I know a lot of people got burned . .BUT the project is still the same project , and the tokenomics soon improve, as from next month - I can only be VERY VERY bullish on ICP . .
Sentiment may be very bearish towrds it, but business is business, and when the "day of reckoning" comes - and the REAL BIG BOYS enter the market, projects like ICP will ROCKET and old hat sentiment for the likes of absurdly outdated coins like Litecoin / ETH Classic /ECT ECT will be dust . . .EVEN ETH and BTC will have to be RADICALLY improved , if they hope to survive - Mining is an absurd concept, and always was !
The main-stream banks /finance could kill crypto tomorrow - BUT they want the tech . .and the technicians . .they are NOT known for sentimentality !!!. .

ICP appears to be breaking up from a falling wedge.I don’t trust this crypto after it had such a massive free fall from its original price so it wouldn’t surprise me if this is some crazy bull trap…however TA suggest it should be heading back to the $60 range some time in the near future. *not financial advice*

Icp going upBroke resistance. Next target 26, then 37. If 37 broke, we will be back above 200ma and can look for higher moves

ICP - Potential Bullish Reversal!Hello everyone, if you like the idea, do not forget to support with a like and follow.
ICP broke our brown falling wedge pattern upward , but before we buy, we want the bulls to prove that they are strong enough to take over.
on DAILY: ICP is forming an inverse head and shoulders pattern but it is not ready to go yet (still an idea)
Trigger => Waiting for the right shoulder to form and then buy after a momentum candle close above the gray neckline.
Meanwhile, until the buy is activated, ICP would be overall bearish can still trade lower.
Good luck!
All Strategies Are Good; If Managed Properly!
~Rich

ICPUSD - Trade Setup.Accumulate ICP between 16.7$-15.4$.
Place Stop Loss (SL) must at 14.2$.
Selling Target 1 : 20$.
Target 2 : 22$.
Target 3: 24$.

ICP Weekly is a must watchNot a Financial Advisor.
I've been away for a bit - Market looks much nicer!
So I've been working on ICP projects (NFTs) during my absence
I firmly believe this coin will be 4 figs - the development being done on this blockchain is state of the art. Truly remarkable. Developers all know it, few get to see that side, it's going to incredible in the coming years.
ICP is a long term investment - you can make money in the short term likely to hit $100 in the next 8 weeks in my opinion.
BTC integration coming. ETH integration coming before 2023.
This small community is going to continue growing, ICP should turn heads this year.
Breaking major downtrend on the weekly - look into the BTC integration - how many coins have been burned, should help research.

ICP reversal SignsLooking at that the RSI, it made a higher low and the candles made a lower low. The RSI is showing a bullish divergence. Also the price has been falling into a wedge, meaning its running out of sell pressure. The monthly support is at 20$ acting as a resistance right now. i can see that giving and hitting $35 as the next stop. have to see the pattern payout once we're at $35. over all outlook. i can see a reverse head and shoulder playing out to $80. This will take sometime to unfold

ICP in good position to growLooks to have broke a strong downtrend. Prob needs to break the 37 resistance to confirm a real strong upward move to 55, 72, and higher. Short term target of 24 should be hit soon.
I think the key will be breaking the 200ma, which, if this move continues, will probably be in the 33-37 area. Nice bullish movement w RSI relative to price action as well. Four strait Green Day’s, although not super significant, could indicate a general positive reaction to breaking the downtrend.
Not a pro. DYOR. Please leave comments/advice. Always learning…

ICP 1 h longSetup: ICP has forming higher highs and higher lows for the 1hr chart. The 4hr chart is also showing an uptrend. The daily trend however is showing a downtrend, so please do not hold on to this trade for long
Entry: 19.19
SL: Atr trailing SL at 18
TP: 23.61

ICP to $38 in April?If we continue to see BTC pump into spring time I think it we can expect alts to follow.
I expect ICP to head toward the point of control of this lower price range at around $20. This would coincide wit a break of the descending wedged.
It would then be reasonable to see a bullish retest at the top of the wedge before a continuation to what I consider the first major level at around $38-$40.
A break and hold of $38-$40 would confirm a macro reversal. I expect ICP would challenge that $87 local high shortly after.
I think we could see the retest of the $38-$40 by mid April.

ICP breaking MAJOR resistance Could always be a fake out so we need to retest for confirmation, but this is the first time in months ICP has been on this trend, so a big, big move could be imminent. RSI is showing very bullish divergence on the weekly. Worth keeping an eye on…

Internet Computer ICPStarting to accumulate ICP in this zone and lower, in case btc goes below 30k.
Weekly RSI moving in an interesting channel.
Everyone says this was a scam from VC when it appeared on the exchanges , maybe, but the fundamentals are there = strong project.
