ICPUSDT IDEAUPDATE
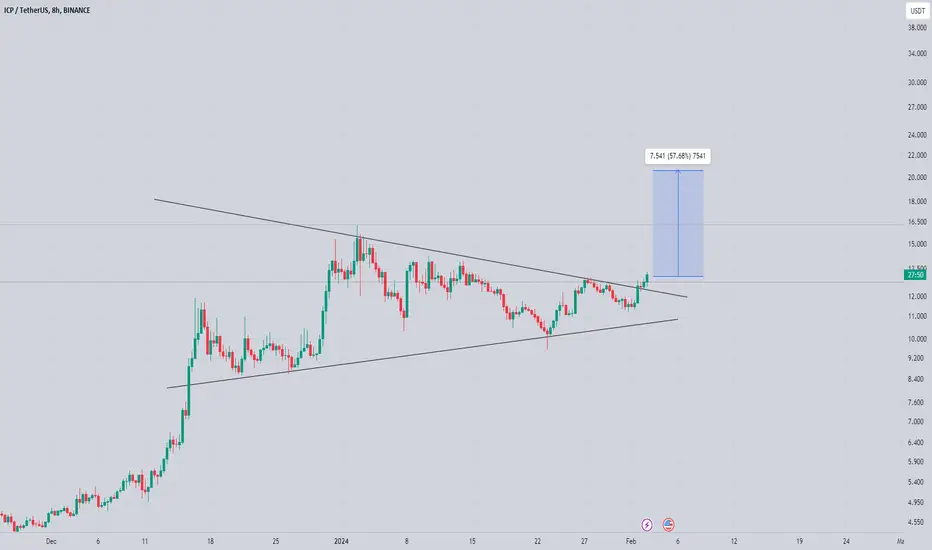
Breakout of Bullish Pennant in 1D.
Successful breakout may lead +30% Bullish move in due time!!!
COIN DETAILS
The live price of Internet Computer is $ 12.72 per (ICP / USD) with a current market cap of $ 5.82B USD. 24-hour trading volume is $ 181.97M USD. ICP to USD price is updated in real-time. Internet Computer is +9.4% in the last 24 hours with a circulating supply of 457.65M. ICP Price History USD.
ICPUSDT trade ideas

ICPUSDT 8HBullish Pennant broken out to the upside. Short-term targets are $15.75 and $17.23
You can check rest of targets on the chart.

ICP/USDT Nearing a Critical Supply Zone Boom or Not?🚀ICP💎 Paradisers, gear up as we spot a thrilling chance with #ICPUSDT, which is on the verge of challenging a significant supply zone.
💎 Observing #InternetComputer trajectory, it's been painting the chart with strong green candles, aiming to shatter the supply zone at $14.049. Here's a crucial point: if the price honors the supply at $14.09, we might see a retreat to the lower demand at $12.013. However, should CRYPTOCAP:ICP disregard this supply ceiling at $14.049, an ascent could be on the cards.
💎 Wondering about the savvy trader's playbook? Vigilance is key, especially with potential price action traps lurking. Remember there's also a chance for a bullish bounce from the demand zone, should our initial read not pan out, with a dip below $12.013 hinting at further declines.

seems like icp preparing for another bullish rally trend is already up and strong now seems like icpusdt is ready for another higher high
bullish pennant breakout has already confirmed expecting another 45 to 50% bullish wave in coming days
keep eyes on icp


ICP inefficiency about to be fillICP is the trade that caught our attention today... After a long consolidation below we see good movement to the upside but unfortunately ICP facing huge resistance on 4hrs and 1hr TF....
When ICP pumped previously we cool see a CHoCH in 4hrs and 1hr TF to the downside with an inefficiency left behind...I'm expecting ICP to fill the inefficiency today and mitigate the unmitigated bearish OB on 1hr TF.... Be patient for the entry and manage your risk
Follow for more market update and trade setup

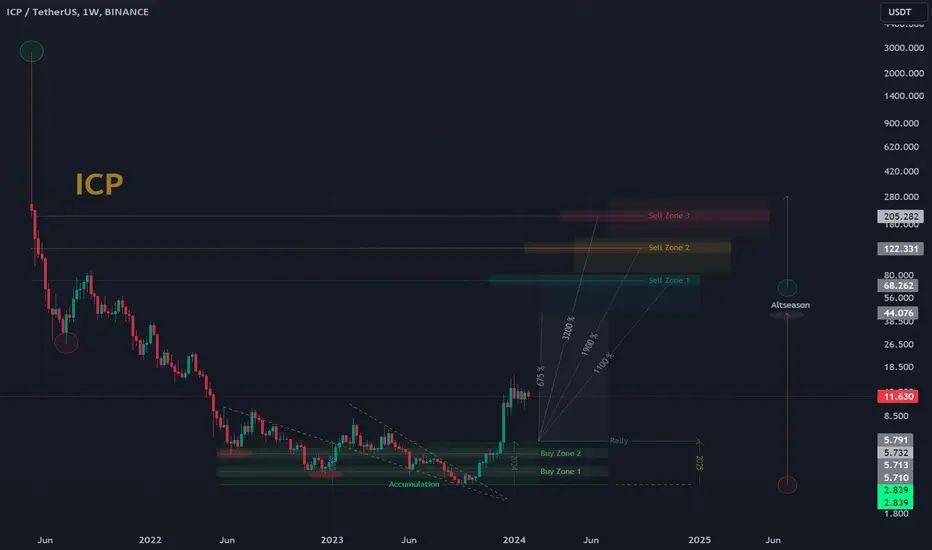
ICP/USDT | InternetComputer |1D 👀1. The tool has performed admirably as expected, but this doesn't necessarily indicate the beginning of a bull rally.
2. For now, I remain bearish for the first quarter, but come April, I will fully transition to the buyer's side and hold all instruments in the portfolio.
3. The next week will be crucial, informative, and volatile. I am exercising patience and sticking to the plan.
- Not financial advice, trade with caution.
✅ Stay updated on market news and developments that may influence the price of InternetComputer. Positive or negative news can significantly impact the cryptocurrency's value.
✅ Exercise patience and discipline when executing your trading plan. Avoid making impulsive decisions driven by emotions, and adhere to your strategy even during periods of market volatility.
✅ Remember that trading always involves risk, and there are no guarantees of profit. Conduct thorough research, analyze market conditions, and be prepared for various scenarios. Trade only with funds you can afford to lose and avoid excessive risk-taking.
#Crypto #InternetComputer #Investing #ICP
Double Bottom Breakout and Symmetrical Triangle = PUMPInternet Computer (ICP) has undergone an extended period of trading within a horizontal accumulation pattern, accompanied by the formation of a significant double bottom pattern with a liquidity grab. Following the successful execution of the double bottom pattern, ICP broke out from the accumulation range, and it is currently trading within a symmetrical triangle. The anticipation is for a potential upward breakout from the symmetrical triangle pattern.
🔄 Horizontal Accumulation and Double Bottom Formation:
ICP's extended consolidation within the horizontal accumulation pattern provided the groundwork for the formation of a double bottom pattern. The pattern is characterized by a strategic liquidity grab, indicating a shift in market dynamics and potential accumulation of positions.
🚀 Double Bottom Breakout Impact:
The successful breakout from the double bottom pattern signified a reversal of the prevailing bearish sentiment. This breakout is indicative of increased buying interest, potentially paving the way for a sustained upward move.
🔍 Symmetrical Triangle Formation:
ICP is currently trading within a symmetrical triangle, marked by converging trendlines that create a triangular pattern. The symmetrical triangle often represents a period of consolidation and indecision in the market, with the potential for a significant breakout.
💡 Anticipating Upward Breakout:
The symmetrical triangle pattern suggests that ICP is coiling within a tightening range. An upward breakout from the symmetrical triangle could signal a continuation of the bullish momentum initiated by the double bottom breakout. Traders and investors may anticipate potential higher price levels if the symmetrical triangle is breached to the upside.
🔮 Future Outlook:
The technical analysis indicates a favorable setup for ICP, with the successful execution of the double bottom pattern and the current consolidation within a symmetrical triangle. Traders should closely monitor the price action for confirmation of an upward breakout from the triangle pattern. The cryptocurrency market's dynamic nature emphasizes the importance of adaptability and risk management in trading decisions. If the symmetrical triangle is decisively breached to the upside, it may open the door for further upward movement in ICP.

ICP- I expect a new leg upIn my previous ICP post, I presented a potential trading plan for this coin. I stated that a break above 14 would indicate that the correction was over. Conversely, if we experienced a break of the symmetrical triangle to the downside, ICP/USDT could drop to 10, presenting a great buying opportunity.
The coin followed the latter scenario. As observed from the chart, it reversed precisely from the indicated support zone and reached a local high at 13. Now, ICP/USDT is undergoing a correction of this initial upward movement, potentially providing a new opportunity to enter long positions.
In conclusion, my preference is to buy dips around 11.50-11.70, with a target in the recent high zone around 16 and negation occurring under 10. Looking at the longer term, as explained in my previous posts, my target is the 20-22 zone.

ICP LongICP Long
Broke out of the trendline and looking to long to next supply zone @ 13.40~
TP1 12
TP2 12.40
TP3 13
TP4 13.40+
SL 10.90
Leverage 5-10x

ICP sell/short setupA large degree triangle is finished. A pattern of the same degree as this triangle is expected to form. That means we will see correction both in time and price.
We are looking for sell/short transactions in the SUPPLY range.
The targets are marked on the chart.
Closing a daily candle above the red range will violate the analysis
For risk management, please don't forget stop loss and capital management
When we reach the first target, save some profit and then change the stop to entry
Comment if you have any questions
Thank You

ICP/USDT Breakout the Bullish Pennant pattern. Bullish Momentum?💎 ICP has experienced significant developments in the market. Currently, ICP has broken out of the Bullish pennant pattern, which is a bullish continuation pattern.
💎 Additionally, the chart has broken through the supply area and is now transitioning to the demand zone. If this scenario plays out as expected, it is probability that ICP will continue its upward movement and aim to reach our target in the bearish OB area.
💎 However, if ICP fails to maintain its position above the demand zone and breaks down below it, there is potential for the price to return to the support area to build new upward momentum.
💎 The support area is a critical zone, and it requires a bounce to prevent the price from heading to the Bullish OB area or potentially moving even lower.


ICP → Pullback to Support Zone Over? Time to Long? Almost!ICP ran three pushes up in an ascending wedge reaching $16.33, followed by a pullback with three pushes down and a strong bull signal. Is it time to long?
How do we trade this? 🤔
A long entry could be justified here. Here's what we have in favor of the long bias; Three pushes up in a bull channel ending at $16.33, followed by three pushes down in a micro-bear channel with strong bull signal bars, and we have a good follow-through bars leading up to the price action being just above the Daily 30EMA.
What would give us maximum justification is a re-test of the Daily 30EMA as support to add probability to our long. However, I do not believe this is required to justify a long entry.
I believe we need to be conservative longing at this stage in the crypto market, which is why I only advocate for a 1:1 scalp at a lower-than-maximum position size allowed for your trading strategy. I think Bitcoin and Ethereum have a larger pullback on the horizon, but do believe the market will come up a bit before it goes down.
💡 Trade Idea 💡
Long Entry: $12.32
🟥 Stop Loss: $9.15
✅ Take Profit: $15.50
⚖️ Risk/Reward Ratio: 1:1
🔑 Key Takeaways 🔑
1. Three pushes up into an ascending wedge.
2. Micro Bear Channel forms with three pushes down.
3. Strong bull signal bars on each push down.
4. Not required, but suggested to wait for re-test of Daily 30EMA as support.
5. RSI at 57.00 and above the Moving Average, supports long bias.
💰 Trading Tip 💰
The longer a trend continues after 3 legs, the probability of that trend continuing lessens. Because of this decreased probability, we ought to reduce our risk when entering trades.
⚠️ Risk Warning! ⚠️
Past performance is not necessarily indicative of future results. You are solely responsible for your trades. Trade at your own risk!
Like 👍 and Follow to learn more about:
1. Reading Price Action
2. Chart Analysis
3. Trade Management
4. Trading Psychology

ICP → Internet Computer Running Out of Gas with Ascending Wedge?ICP gave us another push up after we broke the Support Zone and established support. Now we see ICP coming down to test the Push #2 high of $11.80. The price is consolidating to the upside in an ascending wedge pattern, should we short?
How do we trade this? 🤔
It is not time to short because we're still in the ascending wedge pattern and have not failed to make new highs and new lows. The earliest we should be entering a trade is when the price attempts to make a new high, fails and has broken out of the wedge.
We're looking for a sell signal (bear bar closing on or near its low with a wick top) followed by a confirmation bar (strong bear bar closing on or near its low). The likely price area to enter the short will be around $13.00, but we're still a ways from the target, so we'll have to watch the candles print to size up our entry. A higher probability of profit trade is a 1:1 short scalp to the Support Zone, making the assumption that this will play out as a pullback rather than a bear run.
We need to keep an eye on Bitcoin as it nears $45,000 again. I suspect it will fail to break the neckline but until we confirm that, we can trade as if it won't.
💡 Trade Idea 💡
Short Entry: $13.00
🟥 Stop Loss: $17.00
✅ Take Profit: $8.98
⚖️ Risk/Reward Ratio: 1:1
🔑 Key Takeaways 🔑
1. Three Pushes Up from Ascending Triangle Breakout
2. Ascending Wedge Forming
3. Look for Double Top Wedge Breakout to Short
4. Watch Bitcoins Possible Reversal from $45,800, Impact on Alt Coin Market.
5. High RSI at 63.00 below Moving Average, Supports Pullback to Support Zone.
💰 Trading Tip 💰
Ascending Wedges signal an increased probability of a bear breakout. Combined with three pushes up in a bull trend and strong sell bars (candles with large wicks on their tops), creates conditions where a counter-trend trade is reasonable.
⚠️ Risk Warning! ⚠️
Past performance is not necessarily indicative of future results. You are solely responsible for your trades. Trade at your own risk!
Like 👍 and comment if you found this analysis useful!

✴️ Internet Computer Or... Which One To Short?Leveraged trading is for advanced traders, those market players with a little bit more experience than the rest.
If you are only starting now, it is ultra-wise to consider spot trading and use the more advanced tools such as margin and lev. after several years of success with the low risk venture... Or you can do your research and get started right away.
We share information for beginners.
We trade for beginners mainly but we've been around for a while now, 7 years and counting, so we have to step up.
When looking at the charts, we have so many options which is great but sometimes this can turn into a problem rather than a blessing... Let me explain.
We are looking at the Internet Computer (ICPUSDT) daily chart, which one to short?
One of my supporter was asking if it was ok to join those trades that are already moving. While it is ok, risk is higher and we prefer low risk because the lower the risk, the higher the probabilities of success.
And thus we get to the point I want to share with you today.
We have many Altcoins, some always more advanced than others and choosing can be difficult because we might be overwhelmed or simple just don't know.
Look at the following charts, take a minute of your time... Just a glance: Cardano (ADAUSDT), ThorChain (RUNE), PolkaDot (DOTUSDT) and Solana (SOLUSDT) —What do you see?
Notice that these charts already trade few a levels below resistance, some below EMA50 and others below EMA100 daily.
On the other hand, consider the following list: Binance Coin (BNBUSDT), Bitcoin (BTCUSDT), Tron (TRXUSDT) and Internet Computer (ICPUSDT)... Can you spot the difference?
The former group already moved away for resistance, while the chart setups are good there is higher risk involved. The latter group is trading near resistance, which means that these are better for a short... That's my point.
➖ When selling, choose those near the top/close to resistance;
➖ When buying, choose those near the bottom/close to support.
This way we will always get low risk vs a high potential for reward.
This is not financial advice.
I love you!
Thanks a lot for your continued support.
Namaste.

ICPUSDT: Bullish Trend (AB=CD Pattern)ICPUSDT.P is forming AB=CD Pattern and also move in Bullish trend on 1hr time frame we take a ride on market price for long/buy.

icp on the daily looks incredibleWhen running a fib it's so bullish it didn't even tap the .5 but was above, that's huge!
We see it went and touch a very relevant support line and lasted no longer than a wick with huge buyer support coming in as expectd. The bears had a good run but we see so much bullish presence here we couldn't hide our excitement!

ICP 2H futuresThe destination is clear.
The direction of movement may change due to the change in the input volume.
personal opinion

#ICPIn time H2, it is moving in a descending channel, and if it does not have the ability to break in the red box, it can continue to correct at least until the middle of its own channel. Fibo in the red box has the ability to return at least 100% of the step, which is specified in the chart.

trade inrenge (ICP)📊Analysis by AhmadArz:
🔍Entry: 11.82
🛑Stop Loss: 12.01
🎯Take Profit: 11.53
🔗"Uncover new opportunities in the world of cryptocurrencies with AhmadArz.
💡Join us on TradingView and expand your investment knowledge with our five years of experience in financial markets."
🚀Please boost and💬 comment to share your thoughts with us!

