Previous parallel channel broken what's next ? AMA comingHey guys, we broke the previous channel and a shape is starting to show off, so be carefull guys because it can make a big bounce before coming back to the previous ATH and continue the uptrend. Volumes are still strong. I don't know if the today AMA will change the faith. I think long term hodler have nothin to fear...Let's check this together !
ICPUST trade ideas

Short term - It's a rising parallel channel pattern !We can see both support and resistance levels. If the resistance is broken, it can go until 23usd- to monitor

ICPUSDT Breakout! 1. Accumulation 100 days
2. Breakout candle + volume
If ICP goes right and up, we have a big chance for a great long.

ICP USDTICP Setup. After a confirmed breakout from the marked zone in green, we could take an entry at 19.220 Remember stop loss is your friend. Everything is on the chart.
Entry 19.220
S.L 17.956
T.P 1 19.919
T.P 2 20.985
T.P 3 22.427

ICP/USDT Gearing Up for a Bullish Rally? 👀🚀ICP Analysis💎Paradisers, let's focus on #ICPUSDT, which is currently showcasing exciting market movements within an ascending channel.
💎At the moment, #InternetComputer is making its way towards the ascending resistance, originating from the demand zone. This opens up the possibility for the price to rebound from this zone and embark on an upward trajectory, aiming for the bearish Order Block (OB) as its next objective.
💎However, if CRYPTOCAP:ICP does not manage to rally and instead dips below the demand zone, we might see a pullback to the Bullish OB region around the $10.878 mark, where it could find renewed energy for an upward push.
💎The Bullish OB zone has historically been a crucial point for initiating significant market recoveries upon testing. Yet, a failure of this zone, signaling a bearish trend, may lead to a continuation of bullish momentum from a more subdued position.
💎In the event that #ICP doesn't harness the momentum from this or a further reduced level, a continued decline may follow. Rest assured, Paradisers, your ParadiseTeam is closely watching these developments, ready to offer support and guidance through these market shifts.

ICPThis had never been on my radar before. Looks pretty cool. I don't like waiting for retest after breakouts like this. I'd rather use it as a stop. So you can DCA, you can just market buy and use the range as a stop imo. Reward is good in any case.

Nice pennant ...short term... breaking soonThis pennant will find soon an end of a journey, let's check together what kind of break we will have. For long term I'm bullish on this amazing project ! volume is still good. DYOR ! not a financial advice

ICPUSDT can move up to 22?May be. But be careful with your money and don't forget that digital currency is risky.

ICP/USDT preparing bullish trajectory|👀ICP analysis💎Paradisers, the #ICPUSDT pair is exhibiting interesting behavior. After encountering resistance at a significant level of $20.940, it has regained momentum near a critical support zone at $16.640. If it maintains this pace, there's a favorable chance it will surpass the previously observed resistance level.
💎 However, consider an alternative scenario: Should #INTERNETCOMPUTER fail to hold steady at this support level and slip below it, we need to adjust our strategy. We anticipate a robust recovery from slightly lower levels, specifically at a support level that has been tested twice before.
💎 In the event that the price of CRYPTOCAP:ICP dips below this pivotal area, it's prudent to reassess our approach. Our hope lies in a rebound from the subsequent support line at $15.442. Should it struggle to recover from there, further decline may be imminent. Stay vigilant and adaptable as we closely monitor developments.

ICPUSDT bearish trendICPUSDT is in bearish trend and its showing LL and LH.
Tweezer top can be seen on 45m timeframe chart.

ICPusdtICP is good Coin and now on 1 channel. ithink btc need correction so we can wait and buy on that time. ICP easy can going to 80$ we dont need more high but have potential.
GL
EntryPoint:
16.305
13.945
12.300
10.850
8.860
7.190
Supports:
5.741
4.932
3.720
2.475
Resistances:
19.085
22.510
Targets:
28.431
38.300
MidTime:
55.920
68.110
90.650
HODL:
154.230
225.230
and you can GOALS but we dont know can going or not with this tokenomic
365
620
GL

ICP Road Map🗺️!!! situation+next targets.Hi.
COINEX:ICPUSDT
Today, I want to analyze ICP for you in a 3D time frame so that we can have a mid-term view of ICP regarding the technical analysis. (Please ✌️respectfully✌️share if you have a different opinion from me or other analysts).
Bullish pennant is on the table on 3D timeframe🔍
Looking for a break out and more upside📈
✅ Due to the Ascending structure of the chart...
- High potential areas are clear in the chart.
- AB=CD
- Ascending pennant
Stay awesome my friends.
_ _ _ _ _ _ _ _ _ _ _ _ _ _ _ _ _ _ _ _ _ _ _ _ _ _ _ _ _ _ _ _ _
✅Thank you, and for more ideas, hit ❤️Like❤️ and 🌟Follow🌟!
⚠️Things can change...
The markets are always changing and even with all these signals, the market changes tend to be strong and fast!!


Icp looks looks the god candle is coming. Icp looks ready for 22 usd coming. The trend on the weekly looks 1 more push before a good pullback .
NFA just my thoughts

icpSupport and press the rocket to cheer me up
Observe the ten percent loss limit
Stay away from Bitcoins
Feel free to buy and sell and post your comments


Internet Computer ($ICP) Soars 70% as Network Ventures into AIAfter a prolonged period of dormancy, CRYPTOCAP:ICP has emerged from the shadows with an impressive 70% price surge, capturing the attention of investors and enthusiasts alike. This resurgence comes on the heels of a groundbreaking announcement unveiling the integration of AI functionalities within the Internet Computer ecosystem.
The introduction of AI Smart Contracts marks a watershed moment in the evolution of blockchain technology. It signifies the convergence of two revolutionary domains, each poised to redefine the way we interact with digital systems. By harnessing the power of AI within the secure framework of blockchain, Internet Computer pioneers a new era of decentralized intelligence, unlocking limitless possibilities for innovation and collaboration.
At the heart of this groundbreaking development lies the visionary architecture of Internet Computer, a World Computer blockchain designed to support the seamless execution of complex computations across a distributed network. With its unique blend of scalability, security, and interoperability, Internet Computer lays the foundation for a decentralized ecosystem capable of hosting AI-driven applications with unparalleled efficiency and transparency.
The implications of this convergence extend far beyond the realm of speculative investment. They resonate deeply with the core principles of decentralization and democratization that underpin the ethos of blockchain technology. By democratizing access to AI capabilities through Smart Contracts, Internet Computer empowers developers and entrepreneurs to unleash their creativity and drive meaningful change across diverse industries.
Furthermore, the timing of this announcement couldn't be more fortuitous, as the broader crypto market experiences a bullish resurgence fueled by renewed optimism and institutional adoption. Against this backdrop of growing momentum, the meteoric rise of ICP serves as a beacon of hope for investors seeking high-impact opportunities in the digital asset space.
However, amidst the euphoria surrounding ICP's price surge, it's crucial to maintain a nuanced perspective on the underlying fundamentals driving this phenomenon. While speculation undoubtedly plays a role in short-term price movements, the long-term viability of Internet Computer hinges on the successful execution of its ambitious vision for AI integration.
In light of these considerations, investor sentiment remains cautiously optimistic, with some predicting a potential price target of $60 by the end of April. Yet, beyond mere price speculation, the true measure of Internet Computer's success lies in its ability to deliver tangible value through innovative AI solutions that resonate with users and enterprises alike.
As AI Smart Contracts continue to undergo testing on Internet computers' testnet, anticipation builds for their eventual deployment on public networks, signaling the dawn of a new era in blockchain-enabled intelligence. With each milestone achieved, Internet Computer solidifies its position as a trailblazer in the convergence of blockchain and AI, paving the way for a future defined by decentralized innovation and empowerment.
In conclusion, the recent surge in CRYPTOCAP:ICP price represents more than just a fleeting market phenomenon—it embodies a profound shift in the trajectory of blockchain technology towards a future where AI and decentralization converge to redefine the boundaries of possibility. As the Internet Computer charts a course toward this bold vision, the world watches with bated breath, eager to witness the dawn of a new era in digital transformation.
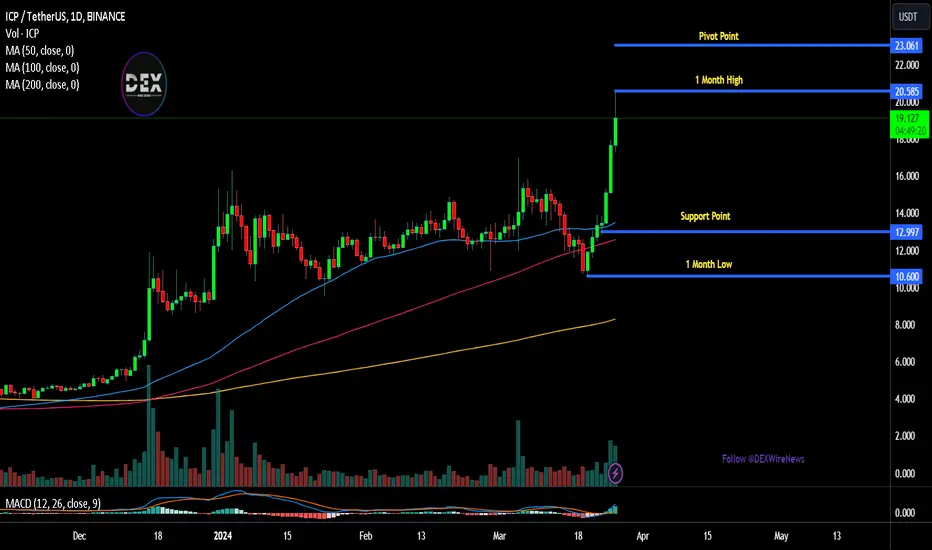
ICP Weekly AnalysisInternet Computer Protocol (ICP) has experienced a remarkable surge, peaking at $19.78, marking an impressive 72.64% increase. This rally commenced following the conclusion of its bearish trend, diverging from the $10.54 price point.
Presently, the price is encountering resistance at $19.772, leading to sideways accumulation, with interim support identified at $18.876. A breach of this level could potentially extend the support retest to $17.216.
Technical indicators and moving averages unanimously indicate a robust buy signal for ICP, projecting favorable prospects in both the midterm and long term.

Crypto ICP to?Currently priced at $19, ICP offers a compelling entry point for investors and enthusiasts alike.
Analysts foresee ICP's price potentially soaring to €200 and beyond, making it an attractive prospect for those seeking long-term investment opportunities.

ICP Ready For A 200% Push Up?ICP is project I have never charted but have alot of interest in the "proclaimed" fundamentals behind it. At least the idea of reverse gas fees and universal integration. Mass adoption would be kin to daily use by the general public... Daily use by the masses with Gas fees? Gas Cost? Understanding? Mass Scale? Good luck...
While ICP may have some of the fundamentals to clear those hurdles at end of the day I am a technical operator and view the chart as the final culmination of all buying and selling decisions. The market could care less about individual interpretations.
It is the collective interpretation that moves price. The collective decision is only available on the chart and the activity of the tape. If the collective agree with the fundamentals they will buy and their buys are recorded on the tape along with the decision to sell.
This is a daily chart using the octave method to measure potential areas of interest in the future. This method works by taking the initial range from any major pivot and expanding that range exponentially into the future in both time and price. The bottom run is set at the high of the first high made after any major pivot and increases in equal increments.
Current Trading Plan:
Hold long for the macro golden pocket in the $35-$50 range. This area also aligns very nicely with the .625 or 5/8ths level on the octave scale. Projected move from current price is approximately 200% IF price continues at the same momentum.
Trade Well...
Your Friend,
Degen

ICP - POTENTIAL 200 - 500% IN THIS ALT SEASON
The sell side liquidity was taken and then very swiftly price surged more than 350%. Here is a crossroad for buyers asking the question such as should I buy here at this point? The answer is YES if you don't mind price retracing to discount ($7.55 - 6.30) and DCAing at discount again especially if you're having FOMO (fear of missing out) and NO if you are a conservative and a patient trader waiting to enter at the discount price (retracement - 50-60% Fibonacci level).
Either way, what is worth noting is that BINANCE:ICPUSDT fall from grace -99.90% from it all time high (ATH) and on this ALT SEASON, based on price action, a retracement to at least 38 - 50% Fibonacci golden level which is approximately 200 - 500% from current price is very possible.
I will keep updating as price develops, stay tuned.
OTHER ANALYSIS

ICP on a Bullish Run: Price Soars Towards First ResistanceInternet Computer (ICPUSDT) has been on a tear since October 2023, showing no signs of slowing down. Currently trading at $17.30, ICP is steadily climbing toward its first major resistance level of $23.40.
With ICP breaking key resistance levels, a breakout towards even higher prices could be imminent. However, others caution that the market remains volatile and a correction could always occur.
One thing is for certain: Internet Computer is a must watch closely in the coming weeks and months.

Growth target for Internet Computer ICP price On the one hand, ICP's price is only trying to rebound from the "bottom" where it has been falling mercilessly for investors for 2.5 years since its listing.
On the other hand, the ICPUSD price entered the first strong liquidity zone $15-22 , where for some time some sold and others bought ICP thinking that this was the "bottom" in early 2022
It is likely that the price of the Internet Computer token will be able to reach $21-23 in this race.
However, it is also likely that some holders will start selling their ICPs in the range of $15-22 at the price at which they bought them two years ago and sat through a significant deposit drawdown.
If you believe that the Internet Computer project is reviving and has good prospects for the future, then place a pending order to buy ICP around $6 and wait.
_____________________
Did you like our analysis? Leave a comment, like, and follow to get more
