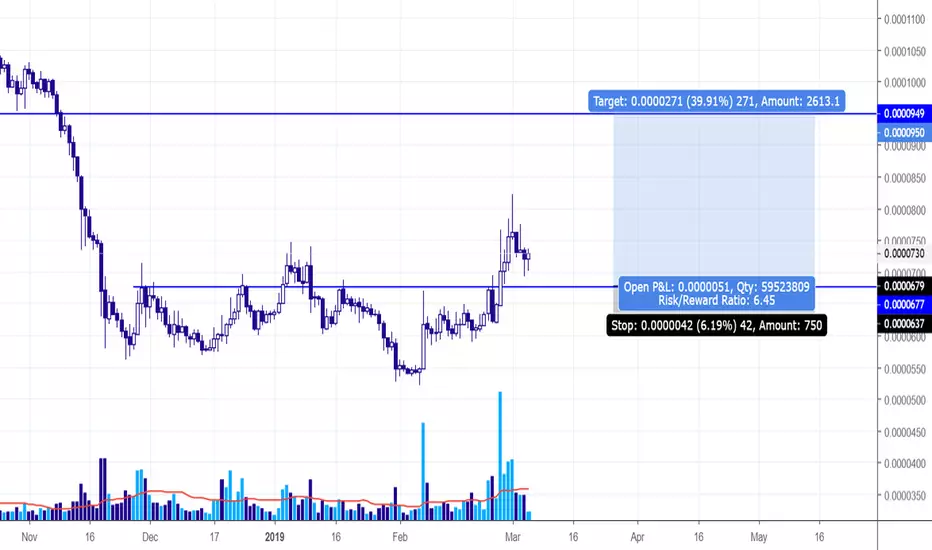
ICX LongICX has seen a huge increase in buying volume over the last months. This volume looks like the biggest we have seen thusfar. This is the reason why we are opening a long position. The big volume does in our opinion not correspond with yesterday's spike and we will probably see a small correction before the next wave up. Please be advised that this is not financial advice, this is just our vision that we would like to share with you guys!
Targets are stated using the fibonacci retracement.
Exchange: Binance
Entry: 680-720
Target 1: 890 (RR-Ratio: 3.1)
Target 2: 990 (RR-Ratio 4.77)
SL: Below 645
RR-ratio: 3.1
If you like the analyses please dont forget to give a like it helps us a lot!
ICXBTC trade ideas


Accumulation and Shakeouts - How To Predict A Potential PumpMy First video idea. Just wanted to talk about something I've been observing in the market recently. This is how I was able to predict the recent ICX and ONT rises.
Hope you enjoy!
This video is not financial advice --- meant for educational purposes only!
-Victor Cobra

Bullish Weekly Chart on | $ICXBTC |Technical Setup in play as we have a confirmed 3-13 ema bullish weekly cross-up plus were printing green bars which says volume is picking up and this uptrend is in play.
ICON is looking great for a swing back above 1000 but you never know when that momo kick in it could see much higher trading prices. Look at the fib retracement for possible answers.
coinmarketcap.com
icon.foundation
Prices as of 3/7/19
$0.325929 USD (14.43%)
0.00008325 BTC (14.35%)
Market Cap
$154,296,969 USD
39,413 BTC
Volume (24h)
$33,725,266 USD
8,615 BTC
Circulating Supply
473,406,688 ICX
Total Supply
800,460,000 ICX


Tres beau setup pour un longIcx tres intéressant pour un court et moyen terme (cassure des deux wedge)
+volume en achat très intéressant depuis les deux dernières semaines.
+News relativement bull avec l'annonce de samsung

ICXBTCSee chart. Idea. This is my viewpoint and my opinion. I am not giving advice but only sharing what I see.

Looking for new Local highs... After the breakout from the bull flag with great volume $ICX reached to break over EMA100(red) & retested it with success after a small pullback.
Now an ABCD could lead us to test ~842sats weekly res.
MACD looking strong, RSI is entering overbought levels.
UCTS Buy signal


ICXBTCICXBTC update
Entonnoir : W/D/H4 (swing)
Le biais en weekly est toujours haussier. Le daily est lui aussi haussier mais n'est plus dans sa fenêtre de tir (et donc plus safe à trader) puisqu'il y a eu un ralentissement à la baisse lorsque l'on a réintégré le sommet daily entouré en blanc.
On aura une nouvelle fenêtre de tir sur le daily une fois qu'on aura cassé le dernier sommet daily (entouré bleu ciel) qui correspond également à la borne haute du range weekly (blanc) et au niveau des ~825.
Pour le moment, aucune opportunité safe.
—————
Funnel : W/D/H4 (swing)
Weekly still shows a bullish bias. The daily is also bullish but has already experienced a slowdown when the price has reintegrated the daily top circled in white and is therefore not safe to trade anymore.
We'll have a shot again if the price break the last daily top circled in light blue, which is also the same level as the top of the weekly compression (white) at ~825.
So far, no trading opportunity.

ICX a clear bull setup*** THIS IS NOT AN ADVICE, DO YOUR RESEARCH AND TRADE WITH YOUR OWN RESPONSIBILITY***
Okay, like other analysis I did recently, I'm gonna align all the reasons down below.
Falling wedge breakout
Sideways Accumulation with good volume

$ICX Range Breakout & S/R Flip$ICX breakout from prior accumulation range. Proven S/R flip and looking to TP at the outlined supply levels


ICXBTC IS LOOKING BULLISHICXBTC IS LOOKING BULLISH: BUILDING A NICE BULL FLAG VS BTC. GREAT TIME TO INCREASE YOUR BTC

Icon Probably the best example why you shouldn't buy a coin everybody is talking about. 2018 bear market vibes. However, this is a good
chance to make some money.
NEOBTCNEOBTC update
Entonnoir : W/D/H4 (swing)
NEO est toujours sur un biais haussier puisque le prix vient du bas du range weekly (blanc).
Le daily est également en tendance haussière mais n'est plus dans sa fenêtre de tir puisque le dernier sommet daily (entouré blanc) a été réintégré à la baisse, ce qui traduit un ralentissement.
Mais en voyant ces deux étoiles du matin en daily, j'envisage tout de même un rebond (flèche verte en pointillés) sur ma zone de S/R des ~700 avant que le daily commence à ranger.
Si on a une belle sortie de compression H4 sur ce niveau des ~700, je prendrai peut-être un petit trade furtif (trade risqué).
—————
Funnel : W/D/H4 (swing)
We still have a bullish bias on NEO as the price is coming from the bottom of the weekly range (white lines).
The daily is also in a bullish trend but is not safe to trade anymore because the price has reintegrated the last daily top (white circle), which means a trend slowdown.
But these two hammers in daily make me think we might have a throwback (green dashed line) on the ~700 (grey zone) before the daily starts to range.
If we got a nice break out from an accumulation on H4 somewhere in the ~700 level, I might go for a quick long (would be a risky move tho).


Retrace before next step up on ICXTwo nasty inverted hammer candles on the daily which signalled a sell off. Good time to buy right now as the price line is failing to get through the 8 day moving average. Potential 9% short term gain if longing from here to the previous swing high. Would put a stop loss at the 13 day moving average. Considering the daily is now in an uptrend I would be careful shorting here!
#icx #$icx #icon #icontechnicalanalysis


ICX reversal happening nowEnter on 2 at the end of the pull back for a ride of the 3 impulse of this elliot weave up to the upper level of the fib - i see consolidation of the first impulse getting ready to move up to the fib levels accordingly.


ICX Chart showing some bullish actionJust finished a long accumulation phase dating back from Nov 2018 till now.
ICX just broke out and should trade sideways for a little bit above 700 sats before a push near 1000 sats where the next resistance is.
