ICX/BTC short term trade opWe have had a few solid trades off ICX in the last week or so, failed attempted to set up for EW recently with a bearish divergence formed on the closes, and can see a gartley harmonic pattern brewing.
Ideal drop to the 786 retracement over all puts a good bounce possibility at around .0000550 btc
We always teach our members to be conservative when trading harmonic patterns specially in crypto markets, 38 and 50% is ideal targets the 618 can some times be a real stretch of a target specially with current market situations.
at the same time the .0000585 level could prove to be a hold up on this down trend and may not reach out entry position, patients is the key here, if it doesnt get there it doesnt get there...move on.
ICXBTC trade ideas


Falling wedge could break soon!$ICX Falling wedge in play. With current market situation I can see #ICX following the rest of the coins and push its value up. MACD & RSI looking bullish. Still no signal from the UCTS. Potential targets on the chart (let it ride...). Happy trading and Monday!


Unknown shitcoin ICXLiking that recent consolidation structure after the pop. Will keep an eye on it

Bearish ICX ChartTheres alot of bullishness going on around these parts figured id toss a bearish scenario out there. First target is head and shoulders break... second target bottom of bear flag there's a lot of volume within the flag of the second so this pattern may not play out this is just a scenario so trade wisely and be smart.
(The white lines) so 505 and 272
Best of luck traders
Remember to always keep an open mind no-one is always right and you should always be questioning your bullish/bearish scenarios with the opposite. I'm not personally trading this but i had the chart already drawn figured id post it.


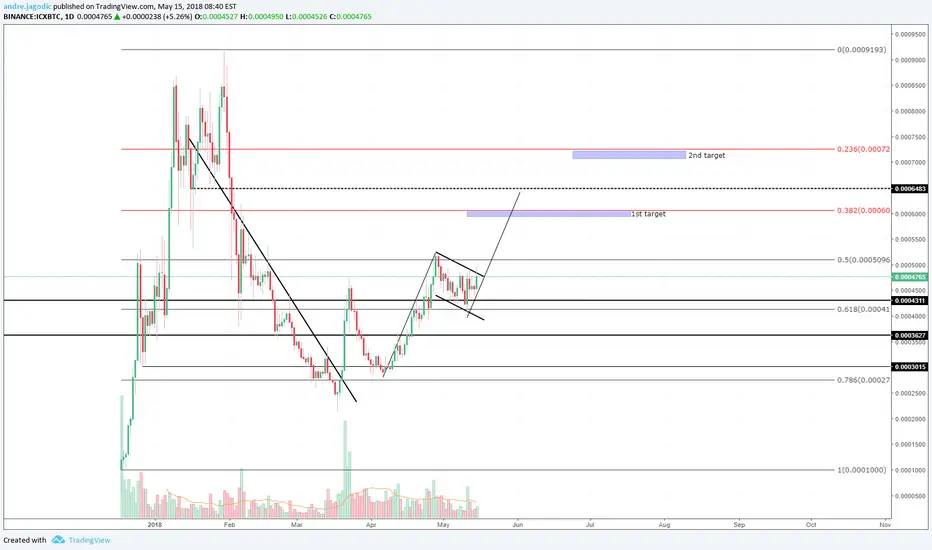
ICX/BTC flag pattern fast / 25% incomingHello traders!
After a really long time i am somehow back. i have a job now and tring to help at home as much as i can since we have some problems... but after all here is my icon/bitcoin chart...
The flag does usually extend to the same lenght as it pole was. that is why there is a black doted line.
First i would look for that 1st target tho. it has just a small resistence there in it might break it to the doted line. That would be a critical area (at least in my opinion. we wee probalby see a retrace betwen 1sttarget and doted line and that is where i would look that we do not lose that 1st target level. if we do.I am selling
Have a good one


ICXBTC - dump or pump ?Just made an idea as per previous swings like a mirror image. Both swings indication made with a different color to easily differentiate. Arrows indicating movement...


Icon ($ICX) - up to 1582% PPT! Long term trade.ICX has been moving sideways for a while now which might be a sign of a accumulation in preparation of new bull market.
Icon is a solid project with working main net and good team with decent PPT.
Buy - green. Sell - red.
It's not a financial advice.
Trade carefully and good luck!


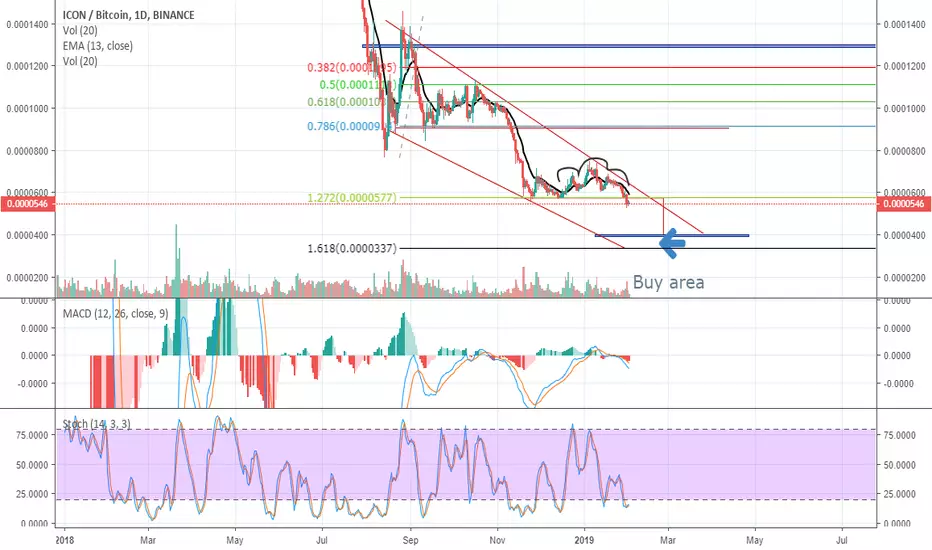
Would you short this? #ICX daily inverted chart.
New all time low reached. Great risk to reward ratio for longing for a LONG term play. Uncertain about short-medium term due to Bitcoin's uncertainty but if you aren't already scaling in here then you should highly consider it at these levels for a long term investment in a fundamentally strong project.

ICX broke All times low.... where to go??$ICX Last 3 trades on #ICX were really profitable using the UCTS ( 43%, 13%, 23% still open position).
Unfortunatelly this asset broke its ATL and now its hard to know when it will stop bleeding.
RSI is reaching oversold levels, so selling now may not be the best idea...or it is?

ICX BTC is a strong bullish buyReversal Pattern should breach; approximate likelihood 80%.
The Target Area is justified using the common fib levels and the 400MA approximately coinciding.
Timmy!

ICX/BTC Daily Chart OutlookHey buds, Taking a look at the ICX/BTC pair today on Binance. Here's the run down.
- Head and Shoulders Bearish Continuation Pattern forming after the long run down
- Support/Neckline is in the 600- 603 box
- Wait for a strong impulse H1 or H4 close either through the support or bounce up
Cheers,
~Chloster
